- GBP/USD is consolidating the losses of the last weeks below the 1.2200 level.
- The levels to beat for sellers are seen at 1.2167 and 1.2136 supports.
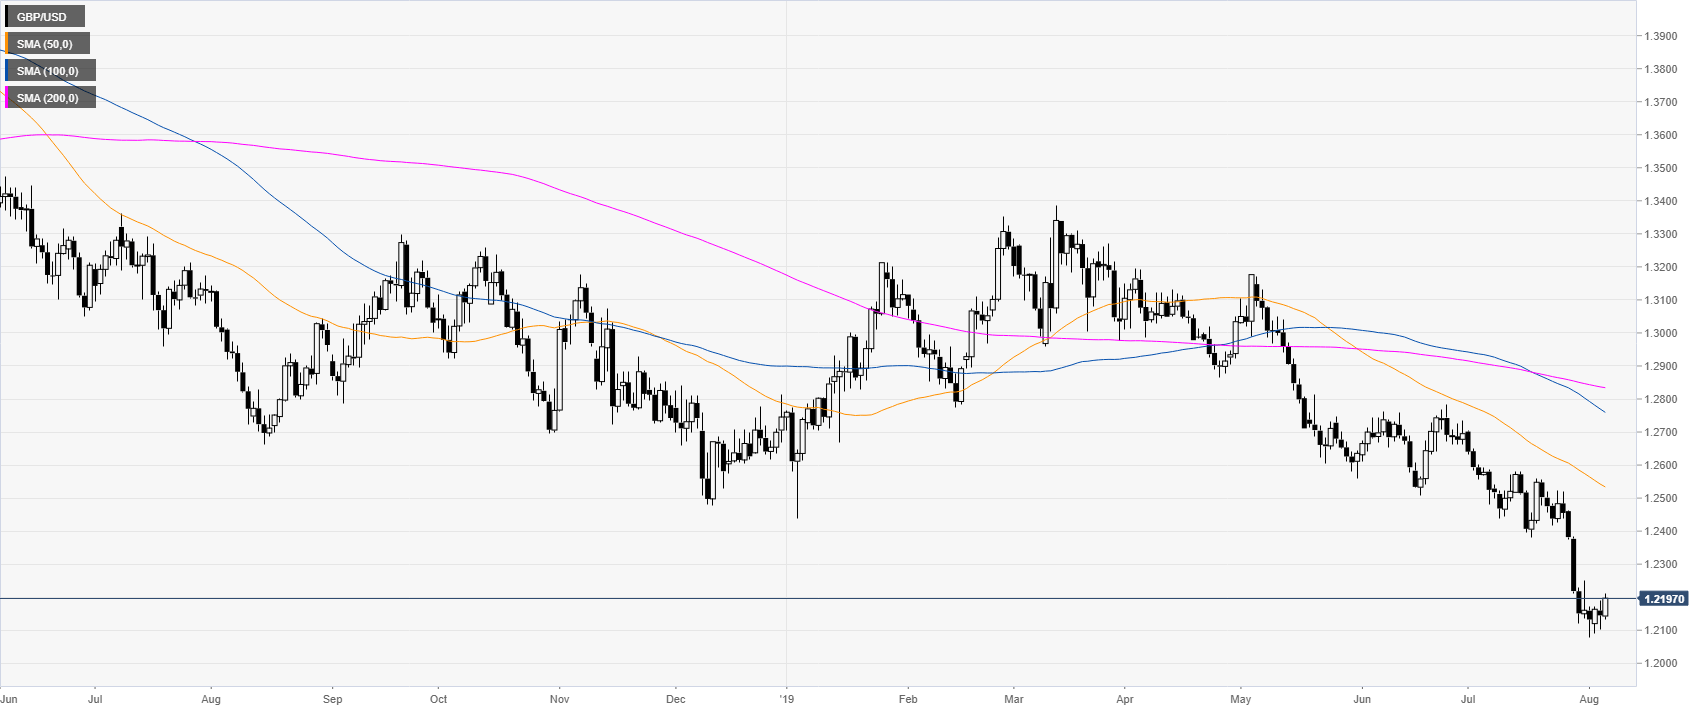
GBP/USD daily chart
GBP/USD is trying to stabilize near the multi-month lows as the market is correcting above the 1.2100 figure. Cable is trading in a bear trend below its main daily simple moving averages (DSMAs).
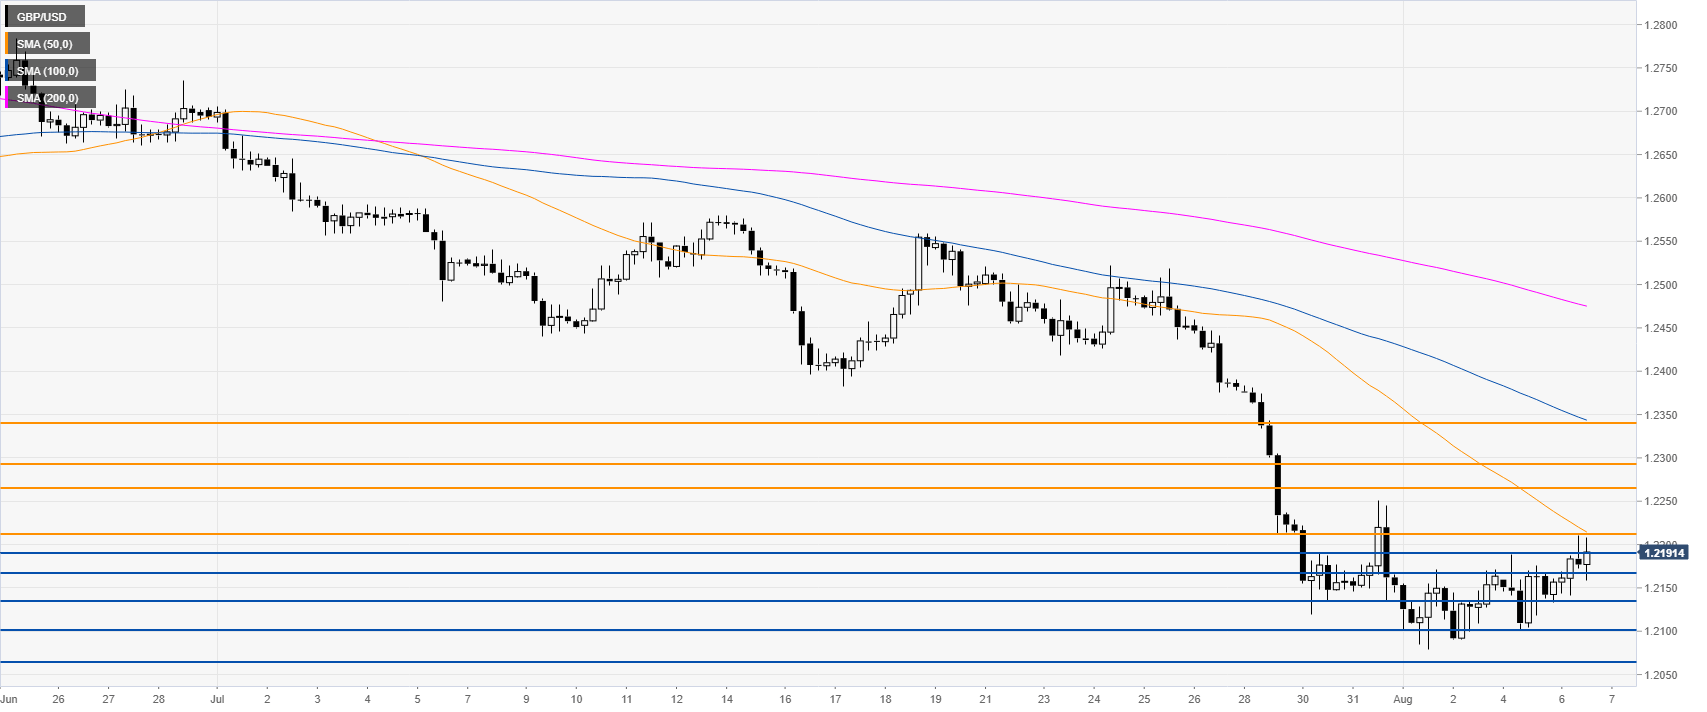
GBP/USD 4-hour chart
GBP/USD is trading below its main SMAs, suggesting bearish momentum in the near term. However, bears will need to reclaim the 1.2167 and 1.2136 support to continue the downtrend towards the 1.2100 figure, according to the Technical Confluences Indicator.
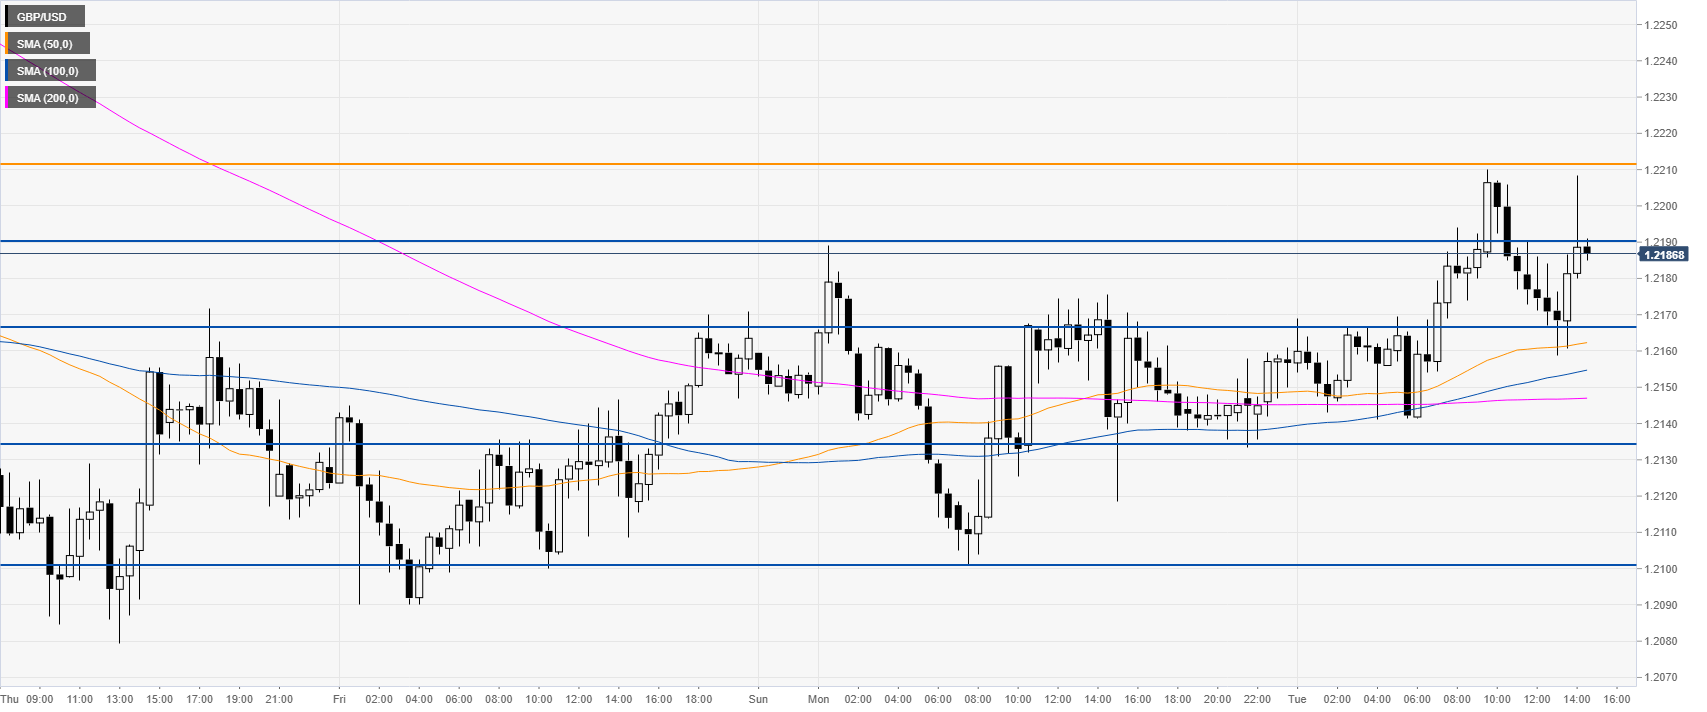
GBP/USD 30-minute chart
Cable is challenging the daily highs and the 1.2211 resistance while trading above its main SMAs. It remains to be seen if bulls can generate a meaningful recovery and break above this resistance to reach the 1.2265 level.
Additional key levels
