- UK PM May is about to allow a free vote on a second referendum.
- GBP/USD is regaining some strength after a massive selloff in the last weeks.
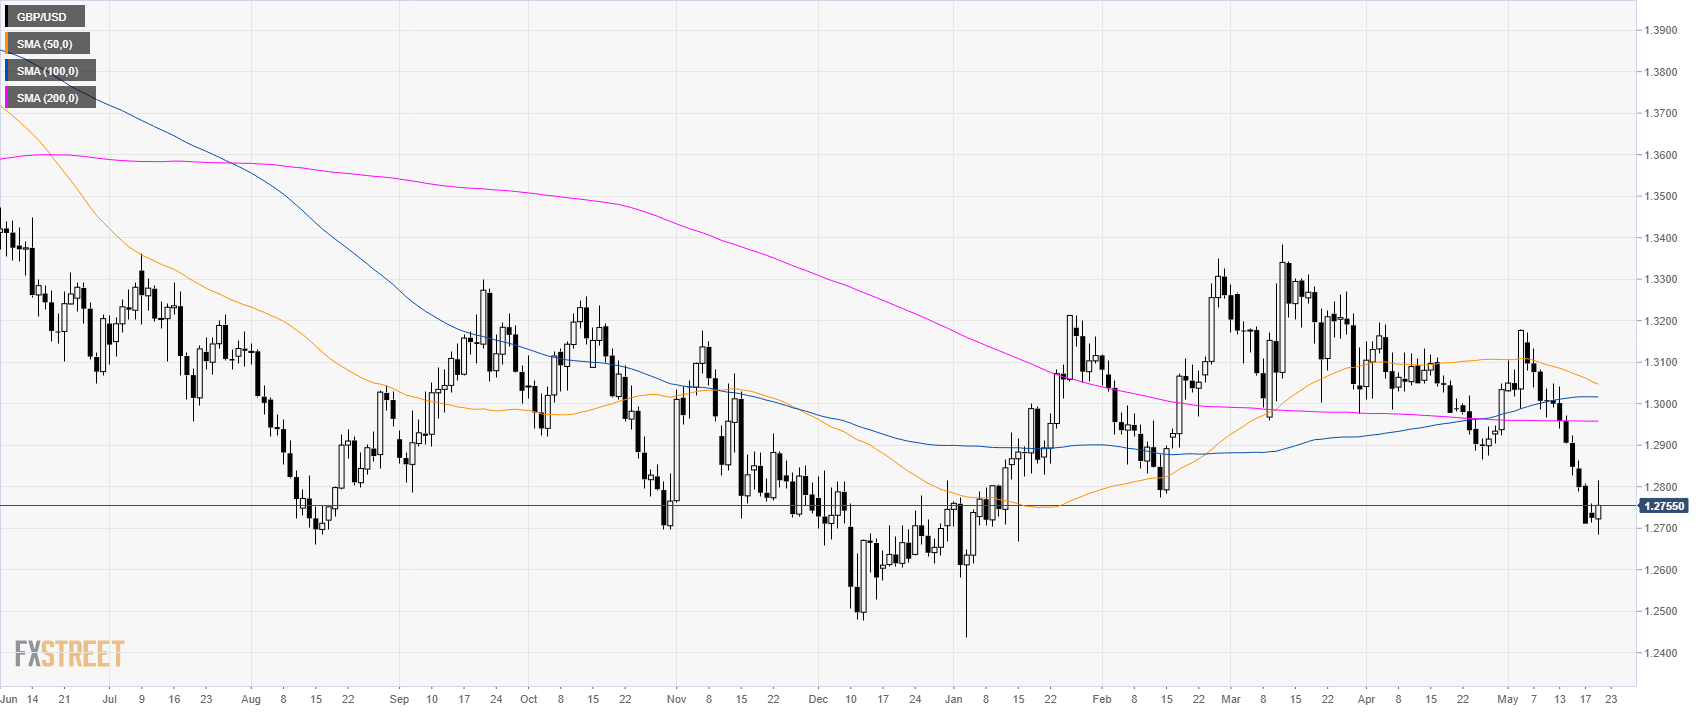
GBP/USD daily chart
GBP/USD is finding some support after the selling of the last weeks. The main supports to the downside are seen at 1.2700 figure, 1.2670 swing low and 1.2550 level.
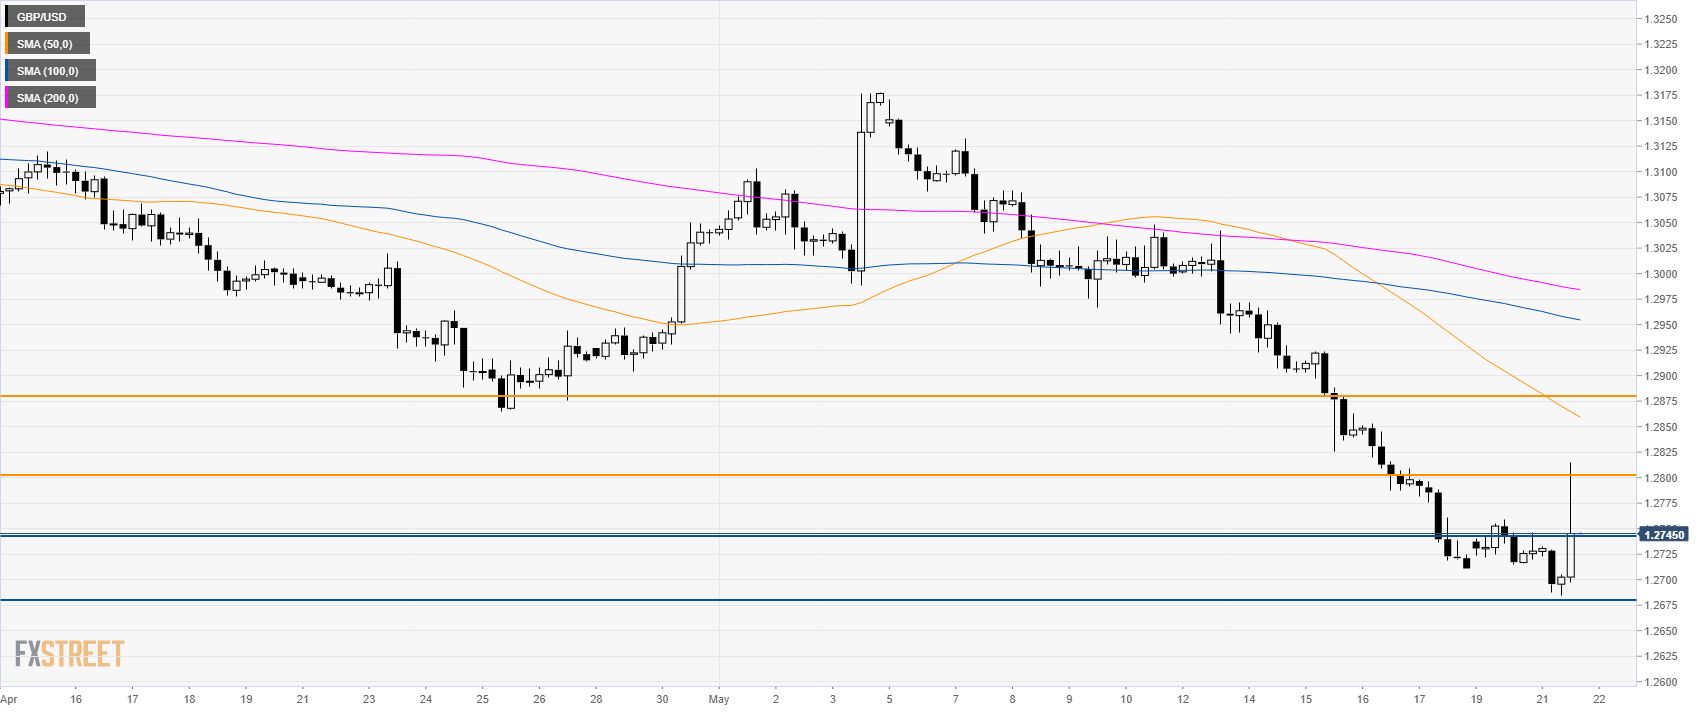
GBP/USD 4-hour chart
GBP/USD spiked above the 1.2800 figure.
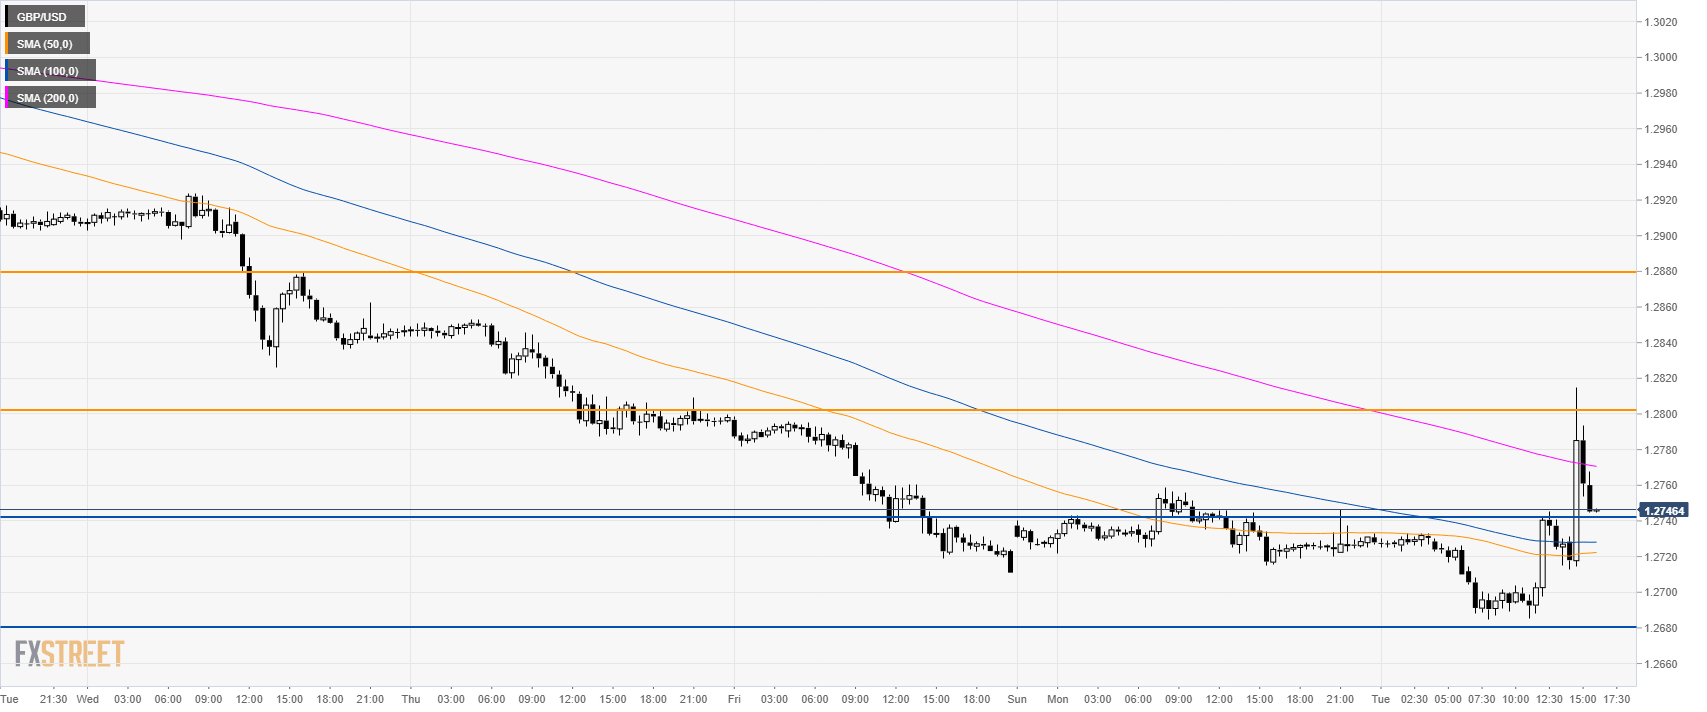
GBP/USD 30-minute chart
GBP/USD is challenging the 1.2800 figure and the 200 SMA. The market will probably continue consolidating in the 1.2700-1.2800 band before any meaningful move in either direction. However, bulls seem to have regained some modest ground. A break above 1.2800 the figure can lead to 1.2880 resistance. Immediate support is at 1.2740 and 1.2860 level.
Additional key levels
