- GBP/USD is switching from a bearish to a bull trend on the daily chart.
- GBP/USD has erased the weekly gains as UK Prime Minister Theresa May warns on a potential ‘no deal’ scenario.
- GBP/USD is trading below its 50-period simple moving average as the market is re-integrating the bull channel (blue lines). Bears made quite some damage and further downward consolidation is to be expected as the RSI, MACD and Stochastics are gaining bearish traction. The main supports are 1.3050 (August 30 swing high, key level) and 1.2957 July 19 swing low.
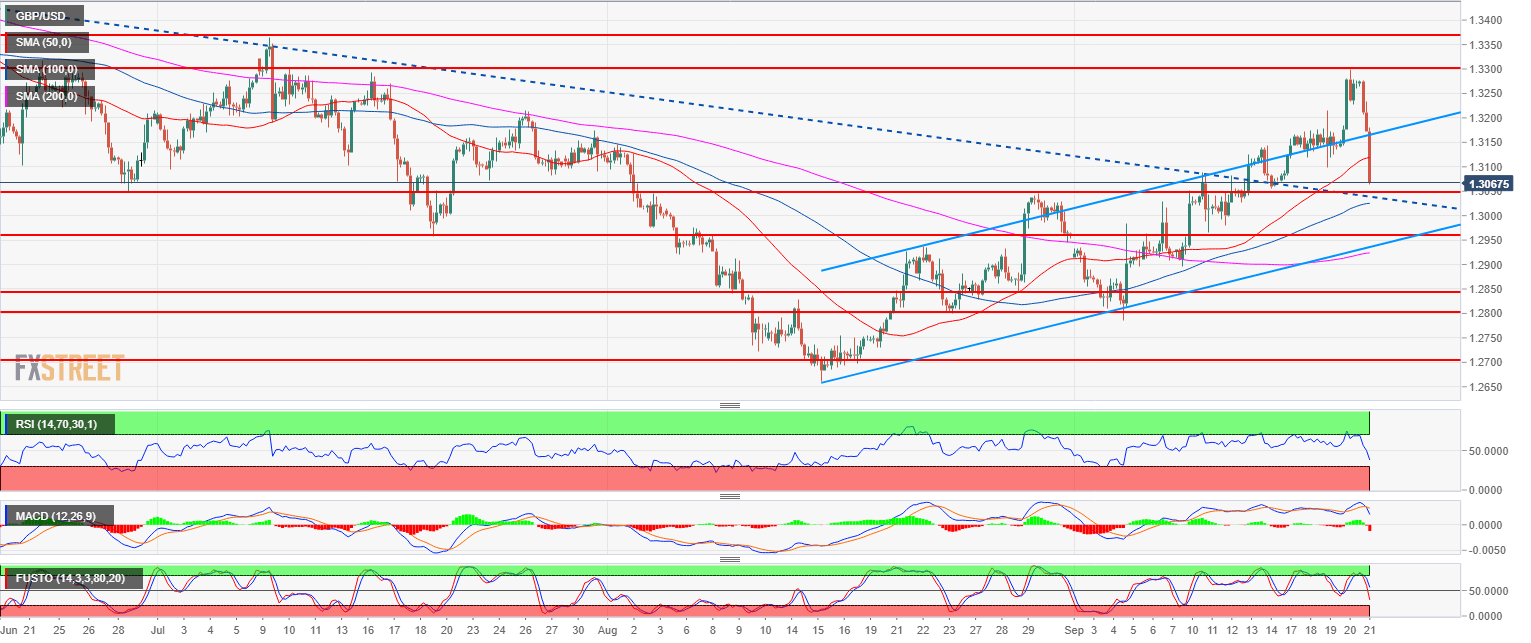
Spot rate: 1.3070
Relative change: -1.48%
High: 1.3276
Low: 1.3063
Main trend: Bullish
Resistance 1: 1.3082-1.3100 supply/demand level and figure
Resistance 2: 1.3144 last week high
Resistance 3: 1.3200 figure (key support/resistance)
Resistance 4: 1.3300 figure
Resistance 5: 1.3363 July high
Resistance 6: 1.3472 June 7 high
Support 1: 1.3050 August 30 swing high, key level
Support 2: 1.3000 figure
Support 3: 1.2957 July 19 swing low
