- GBP/USD spiked to 1.3042 and is currently retreating from the daily highs.
- GBP/USD is evolving below its 50, 100-period simple moving averages (SMA) while it is currently testing the 200 SMA, suggesting an overall bearish bias. However, the RSI is just below 50 while the MACD and Stochastics are displaying bullish momentum. However all-in-all the bias remains bearish with a potential target at 1.2957 (July 19 swing low)
- However, a breakout above 1.3050 and the bearish trendline would invalidate the current bearish bias.
GBP/USD 4-hour chart
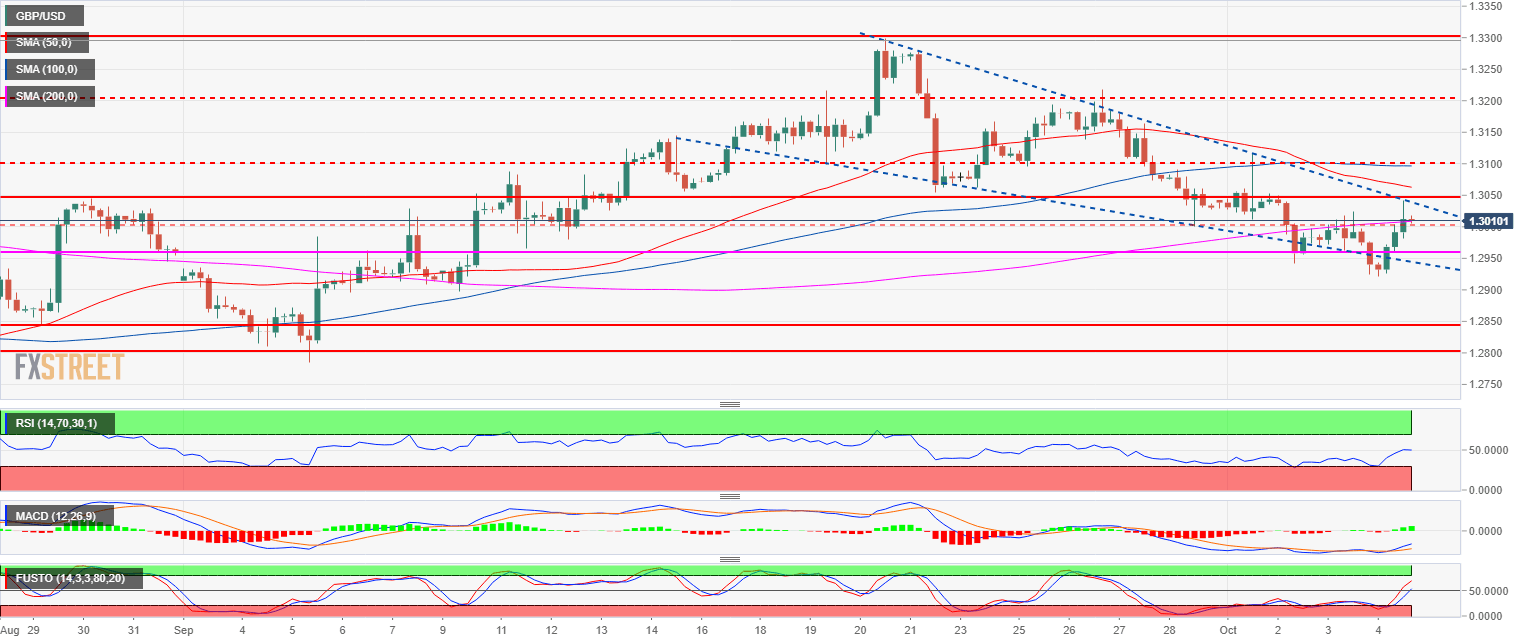
Spot rate: 1.3008
Relative change: 0.51%
High: 1.3042
Low: 1.2921
Main trend: Bearish
Resistance 1: 1.3050 August 30 swing high, key level
Resistance 2: 1.3100 figure
Resistance 3: 1.3150 September 21 low
Support 1: 1.3000 figure
Support 2: 1.2957 July 19 swing low
Support 3: 1.2900 figure
