- GBP/USD erases its intraday losses as the market rises to 1.2175 resistance.
- The levels to beat for bulls are the 1.2175 and 1.2211 levels.
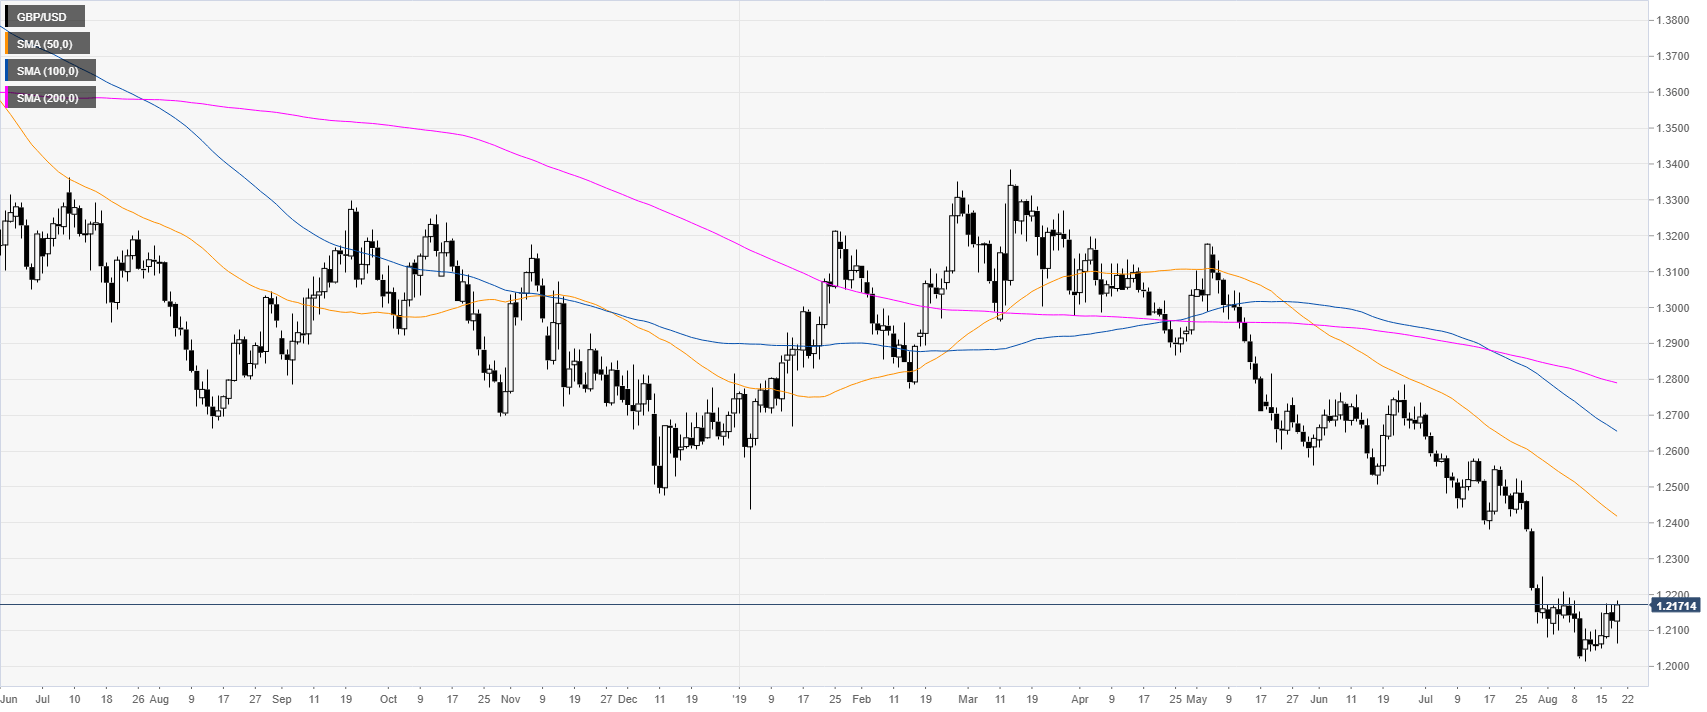
GBP/USD daily chart
The Cable is trading in a bear trend below the main daily simple moving averages (SMAs). The market this Tuesday reversed its earlier losses as spot is heading towards the 1.2200 figure.
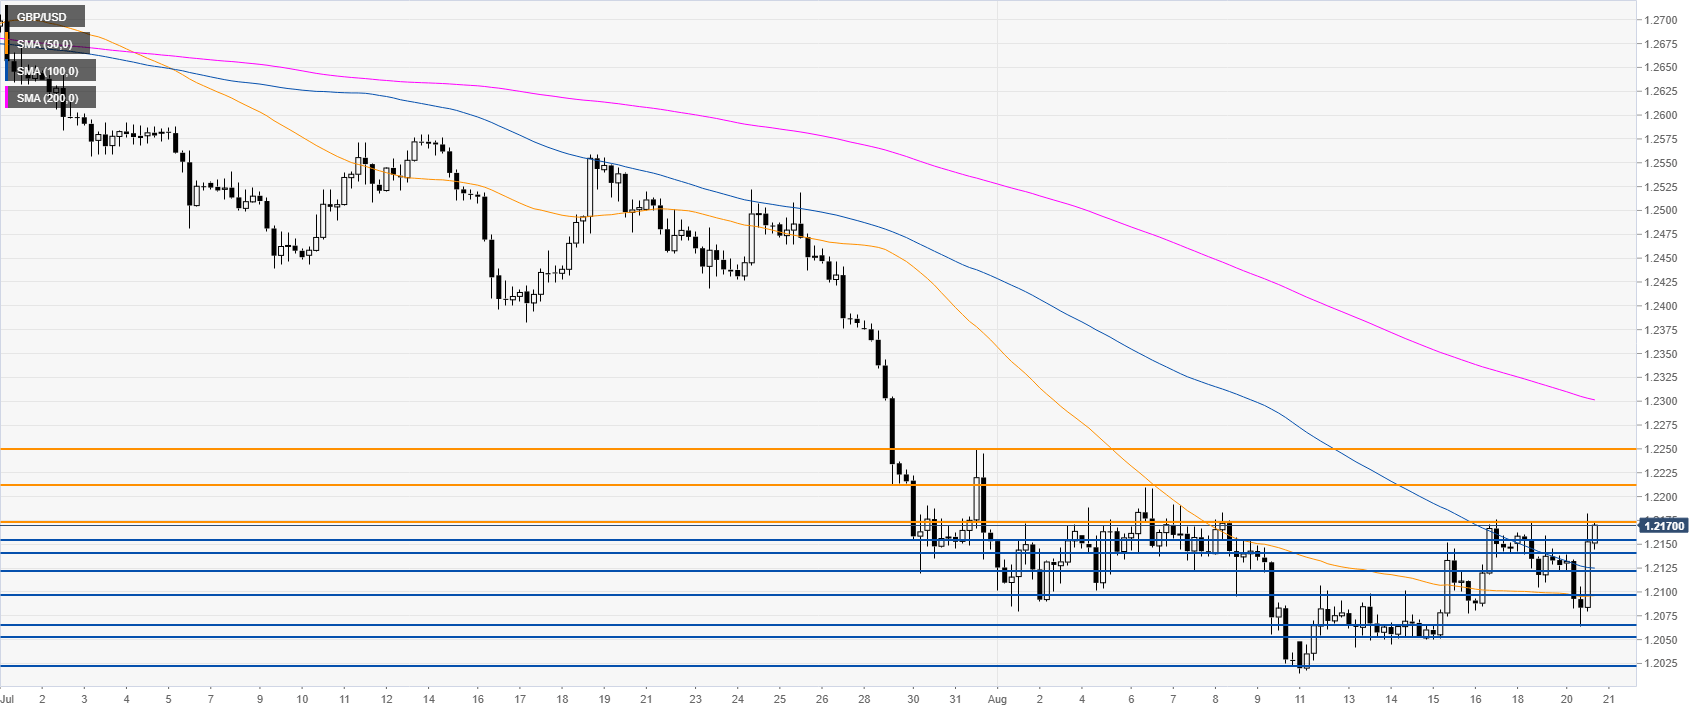
GBP/USD 4-hour chart
The Cable is challenging 1.2175 resistance while trading above the 50 and 100 SMAs. If the bulls break 1.2175 to the upside, the market could accelerate towards the 1.2211 and 1.2250 resistance levels.
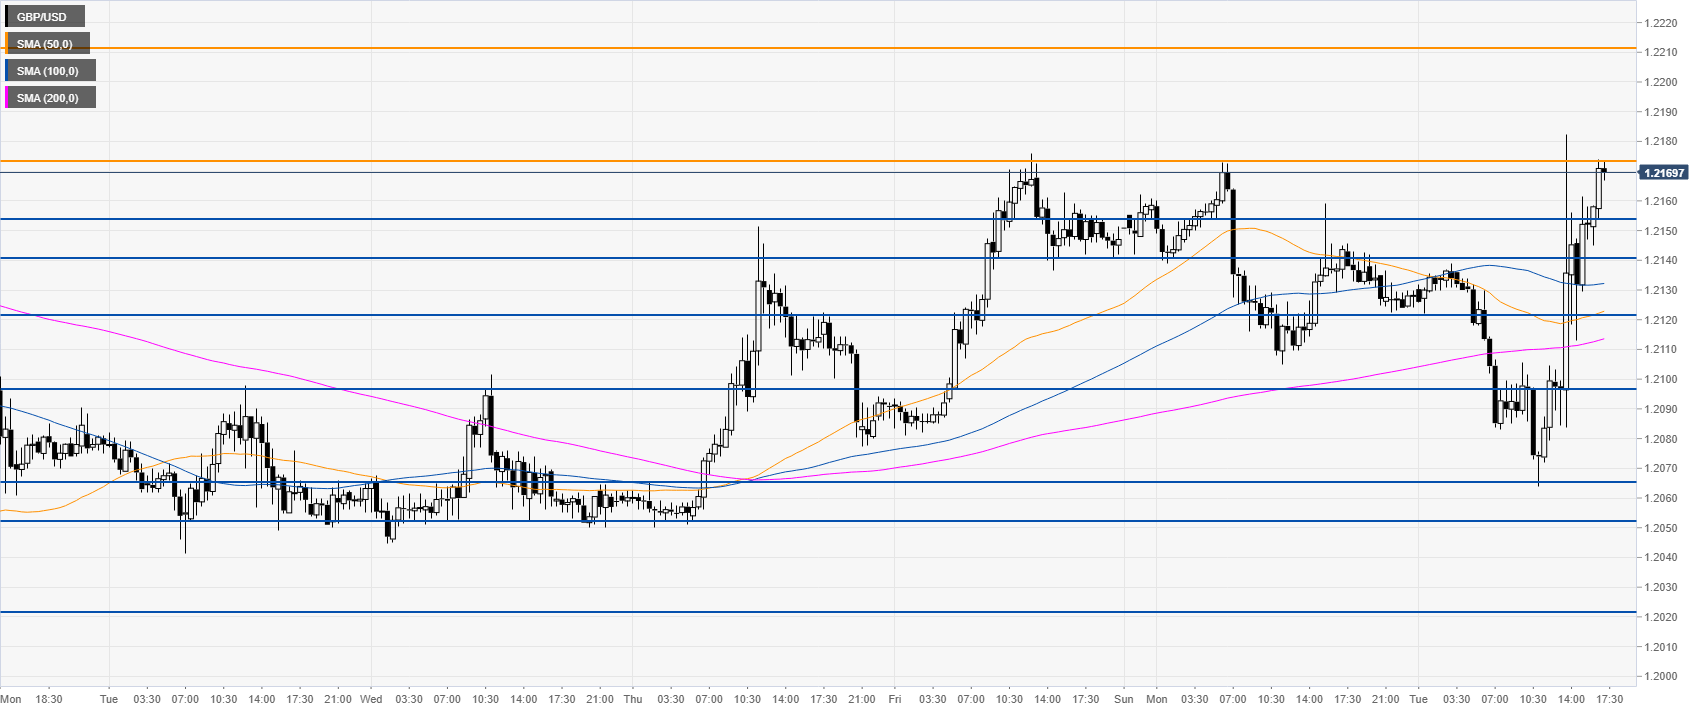
GBP/USD 30-minute chart
GBP/USD had a bullish surprise this Tuesday as the market completely reversed its earlier decline. Bears might have given up suggesting that the path of least resistance is to the upside in the short term. Immediate supports are seen at 1.2154, 1.2141, 1.2122 and at the 1.2097 level, according to the Technical Confluences Indicator.
Additional key levels
