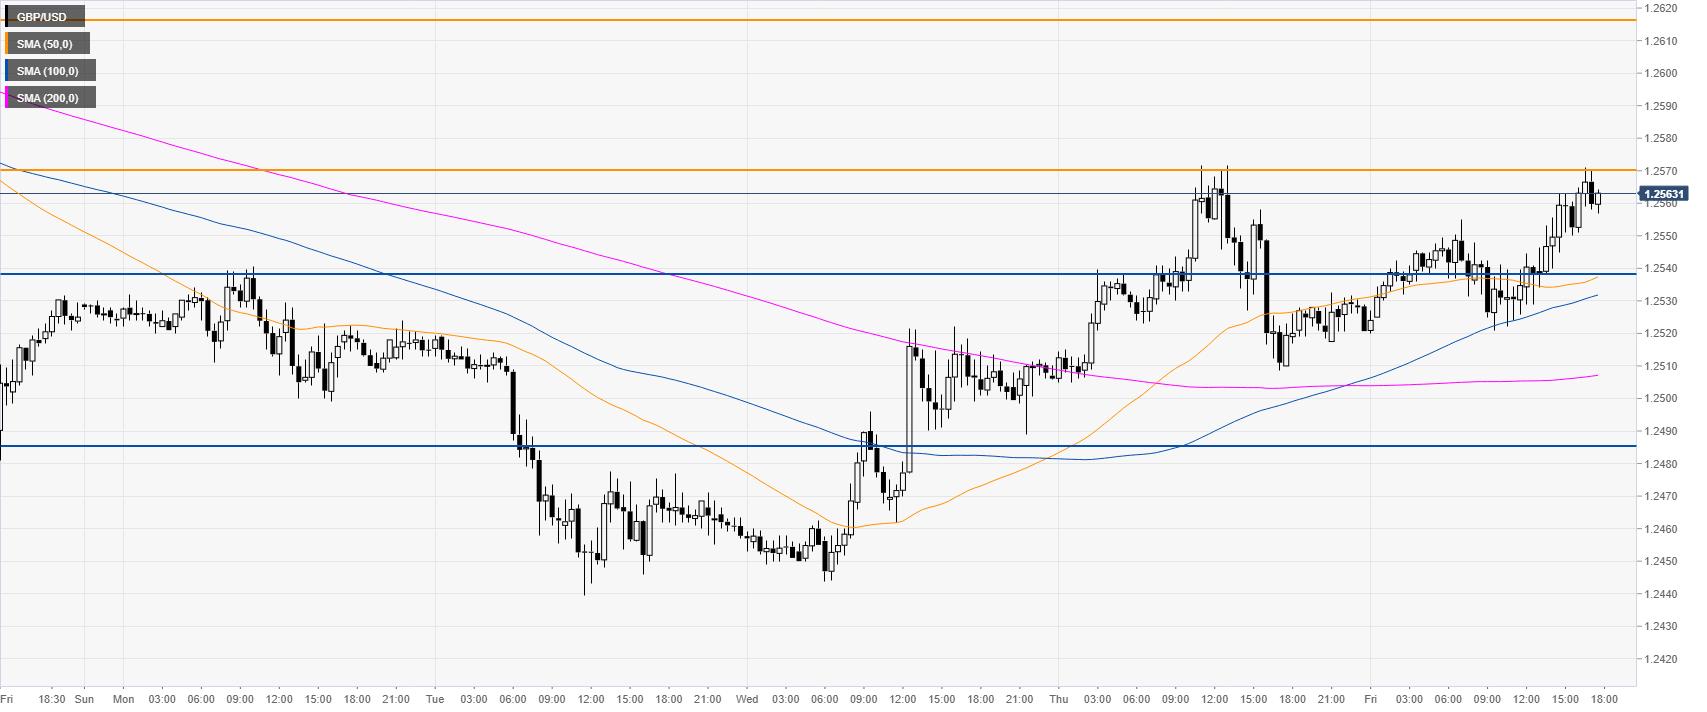
- GBP/USD is challenging 1.2570 resistance and Thursday’s high.
- Support is seen at 1.2538 and 1.2485 according to the Technical Confluences Indicator.
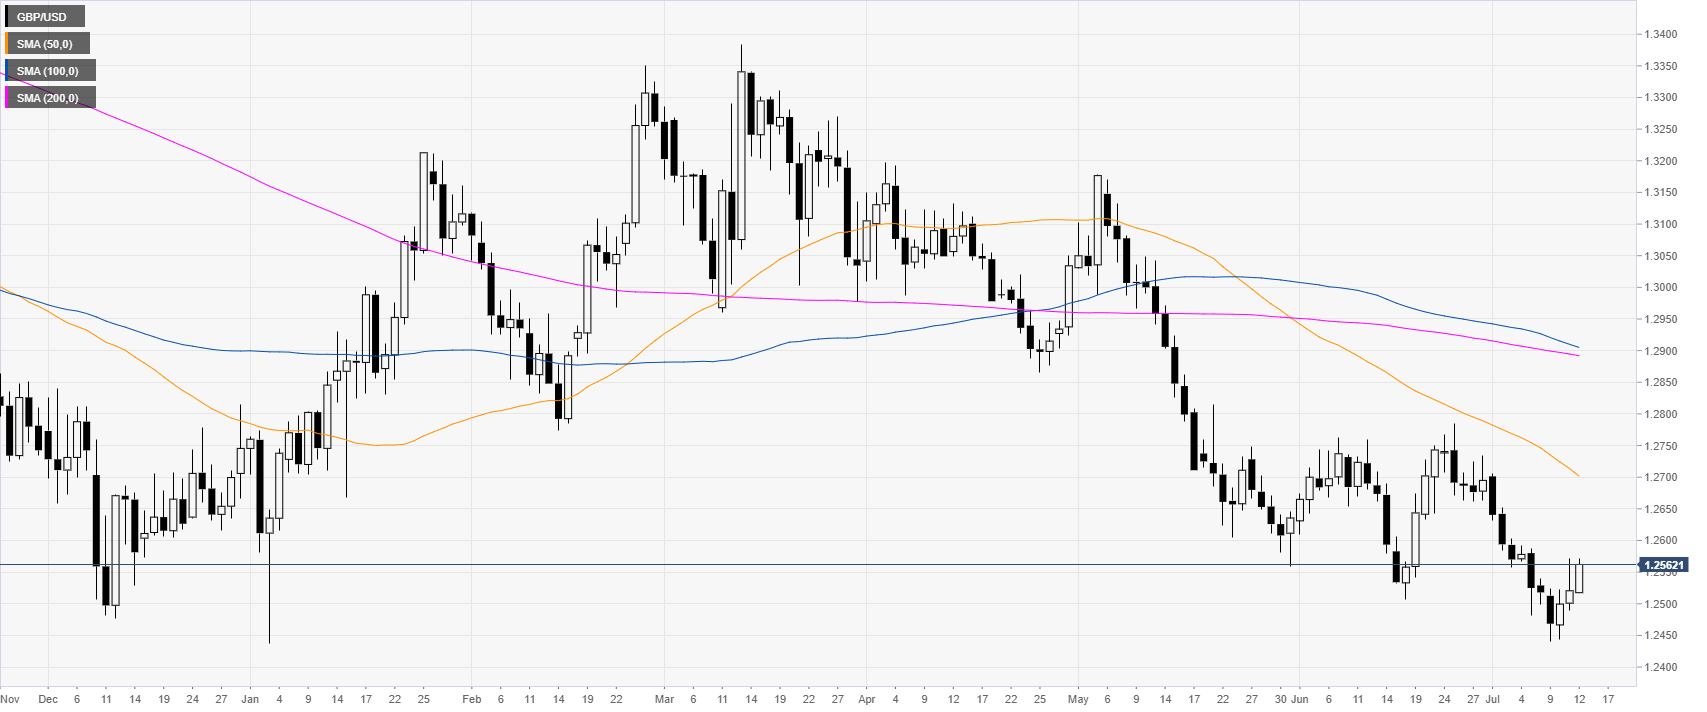
GBP/USD daily chart
GBP/USD is in a bear trend below its main daily simple moving averages (DSMAs). The market is in correction mode above the 1.2500 figure.
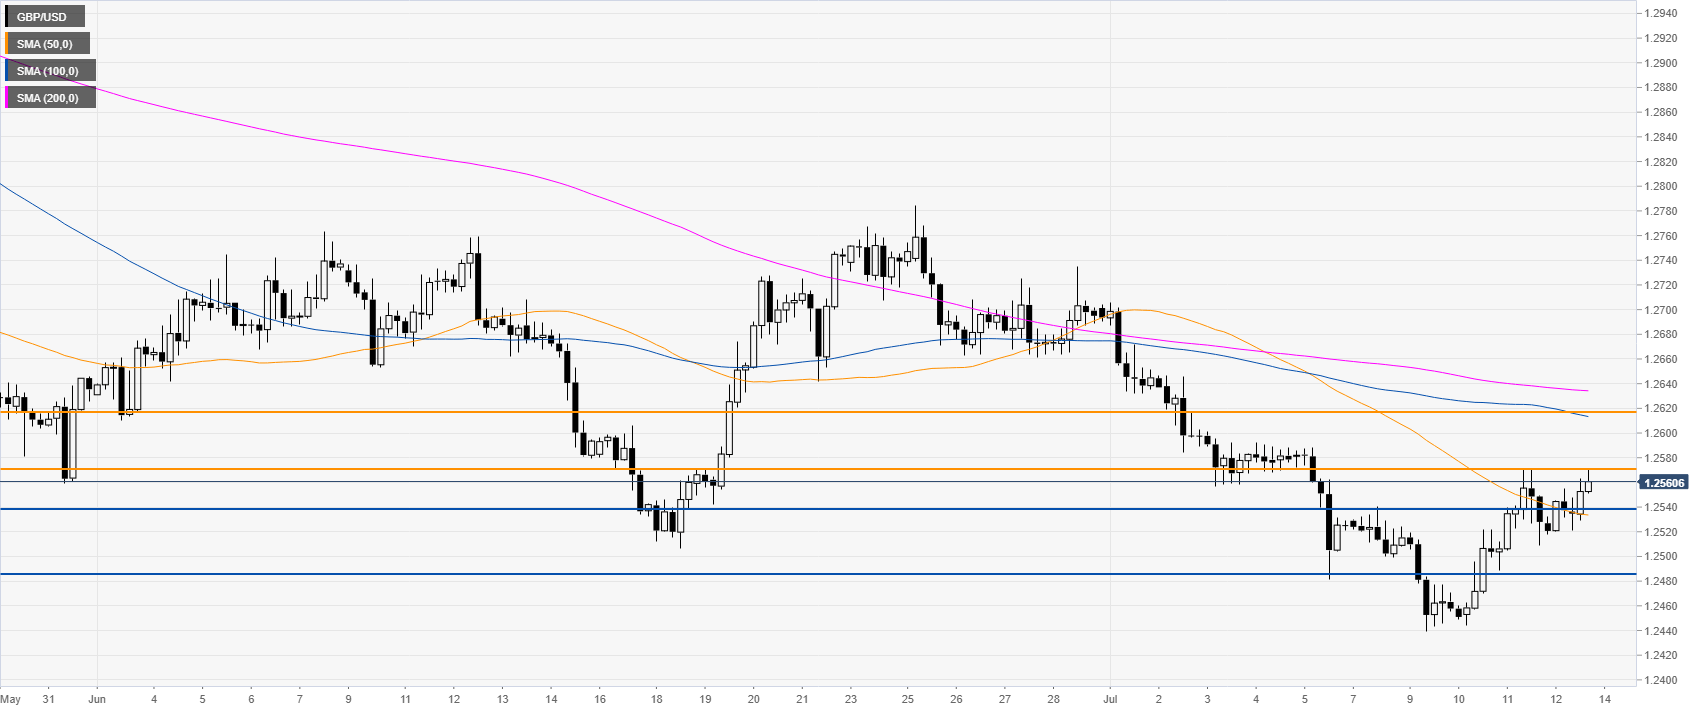
GBP/USD 4-hour chart
GBP/USD is challenging the 1.2570 resistance. A break above it could lead to 1.2617, according to the Technical Confluences Indicator.
GBP/USD 30-minute chart
GBP/USD is trading above its main SMAs suggesting bullish momentum in the near term. Support is seen at 1.2538 and 1.2485, according to the Technical Confluences Indicator.
Additional key levels
