Home GBP/USD Technical Analysis: Cable shorts getting squeezed as bulls break above 1.3100 and now target 1.3200 figure
FXStreet News

GBP/USD Technical Analysis: Cable shorts getting squeezed as bulls break above 1.3100 and now target 1.3200 figure

  • GBP/USD is trading in a bull trend as it is evolving above its 50, 100 and 200-period.
  • GBP/USD broke above a bull flag (blue lines) and now broke above the 1.3100 figure. The picture remains bullish on GBP/USD as long as the market trade above 1.2957-1.3000 figure.  
  • Bulls are now closer to the 1.3200 target as 1.3300 will become the next challenge for buyers.
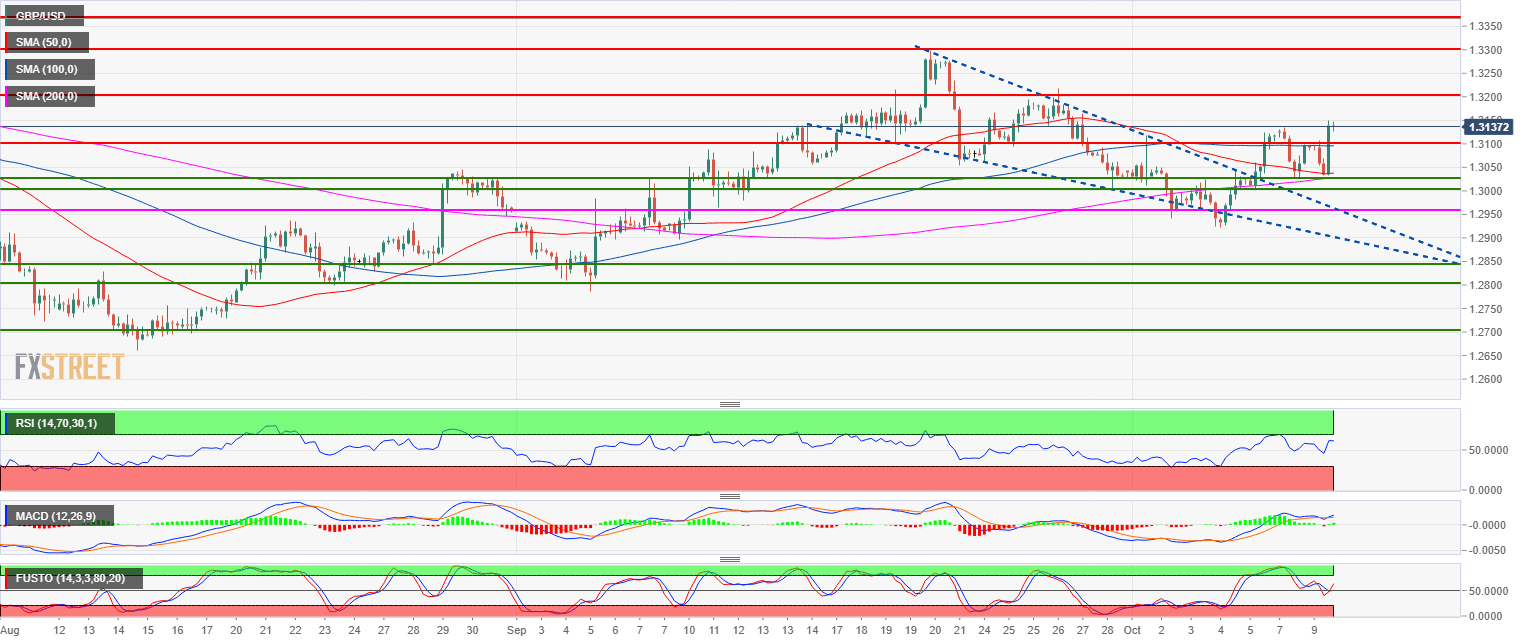
GBP/USD 4-hour chart

Spot rate:                         1.3138
Relative change:              0.38%      
High:                                1.3149
Low:                                 1.3033

Main trend:                      Bullish

Resistance 1:                  1.3150 September 21 low
Resistance 2:                  1.3200 figure
Resistance 3:                  1.3300 figure

Support 1:                      1.3100 figure
Support 2:                      1.3050 August 30 swing high, key level
Support 3:                      1.3028 October 8 low
Support 4:                      1.3000 figure  
Support 5:                      1.2957 July 19 swing low  
Support 6:                      1.2900 figure  

FX Street

FX Street

FXStreet is the leading independent portal dedicated to the Foreign Exchange (Forex) market. It was launched in 2000 and the portal has always been proud of their unyielding commitment to provide objective and unbiased information, to enable their users to take better and more confident decisions.