- GBP/USD is losing steam as it is trading near daily lows.
- Key support is seen at 1.2483 according to the Technical Confluences Indicator.
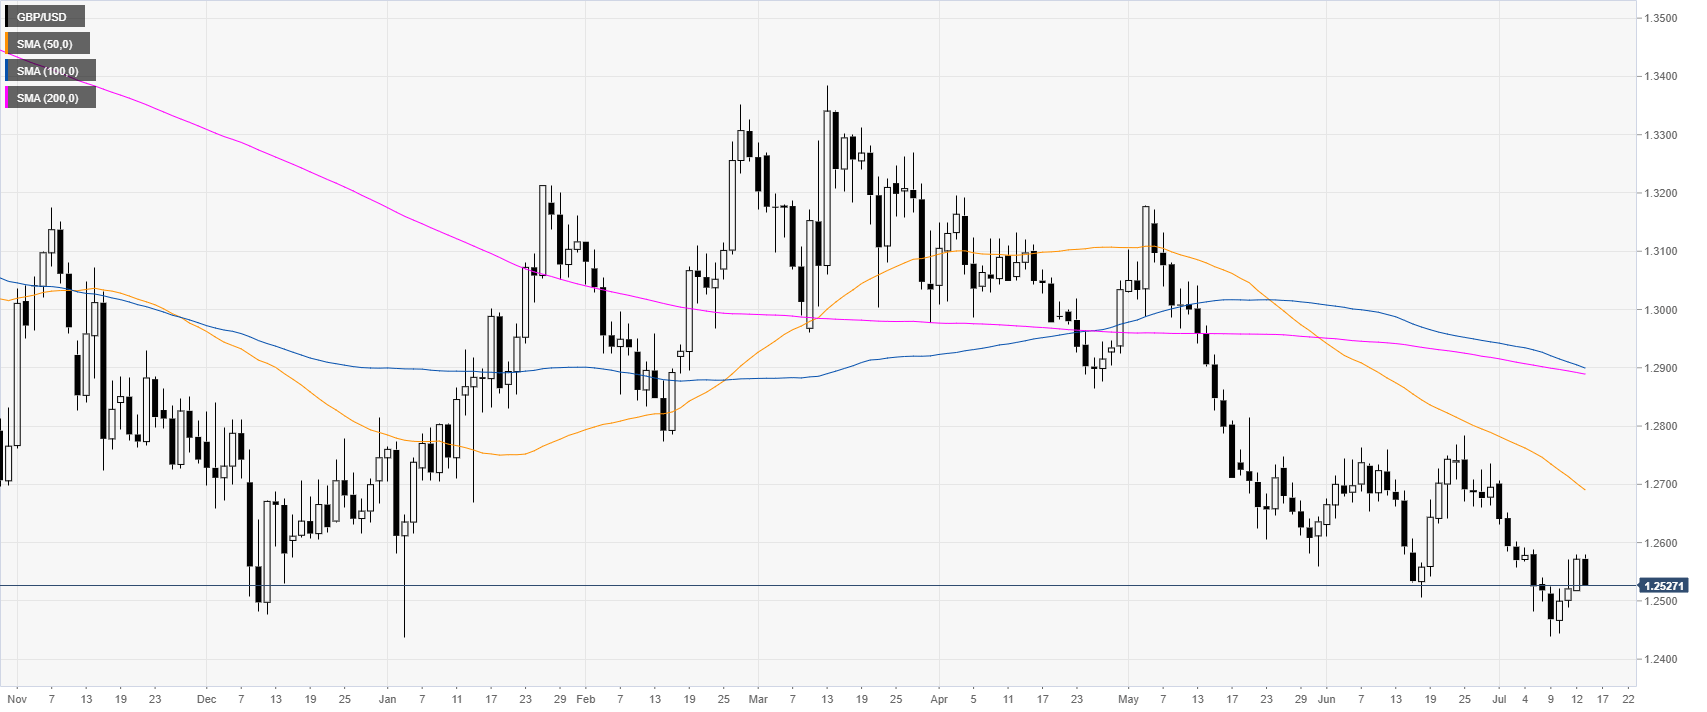
GBP/USD daily chart
GBP/USD is trading in a bear trend below the main daily simple moving averages (DSMAs). The market is close to last Friday’s low.
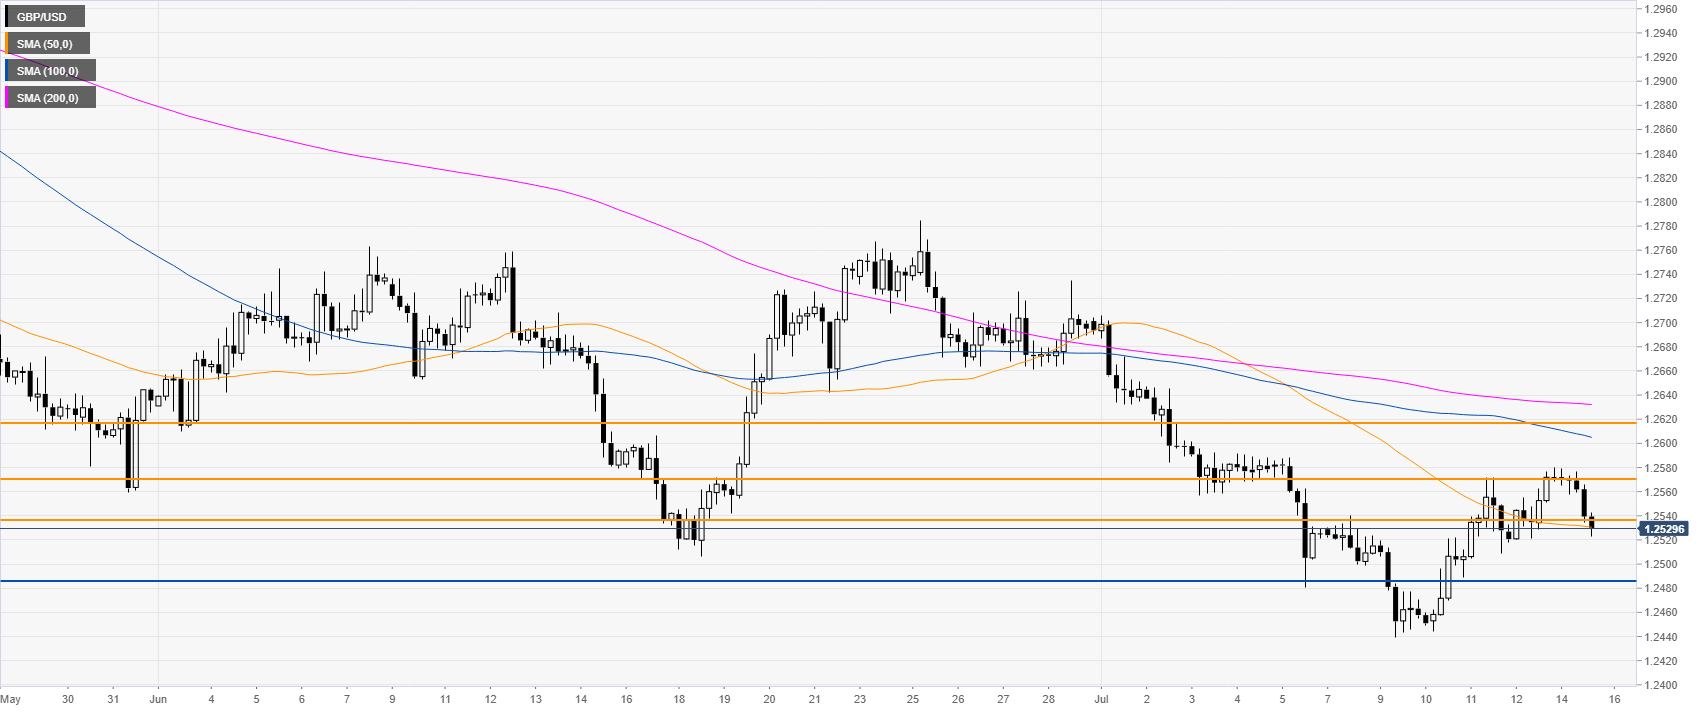
GBP/USD 4-hour chart
GBP/USD broke below 1.2536 support potentially opening the doors for a drop to the 1.2483 level, according to the Technical Confluences Indicator. The market is currently challenging the 50 SMA near 1.2530.
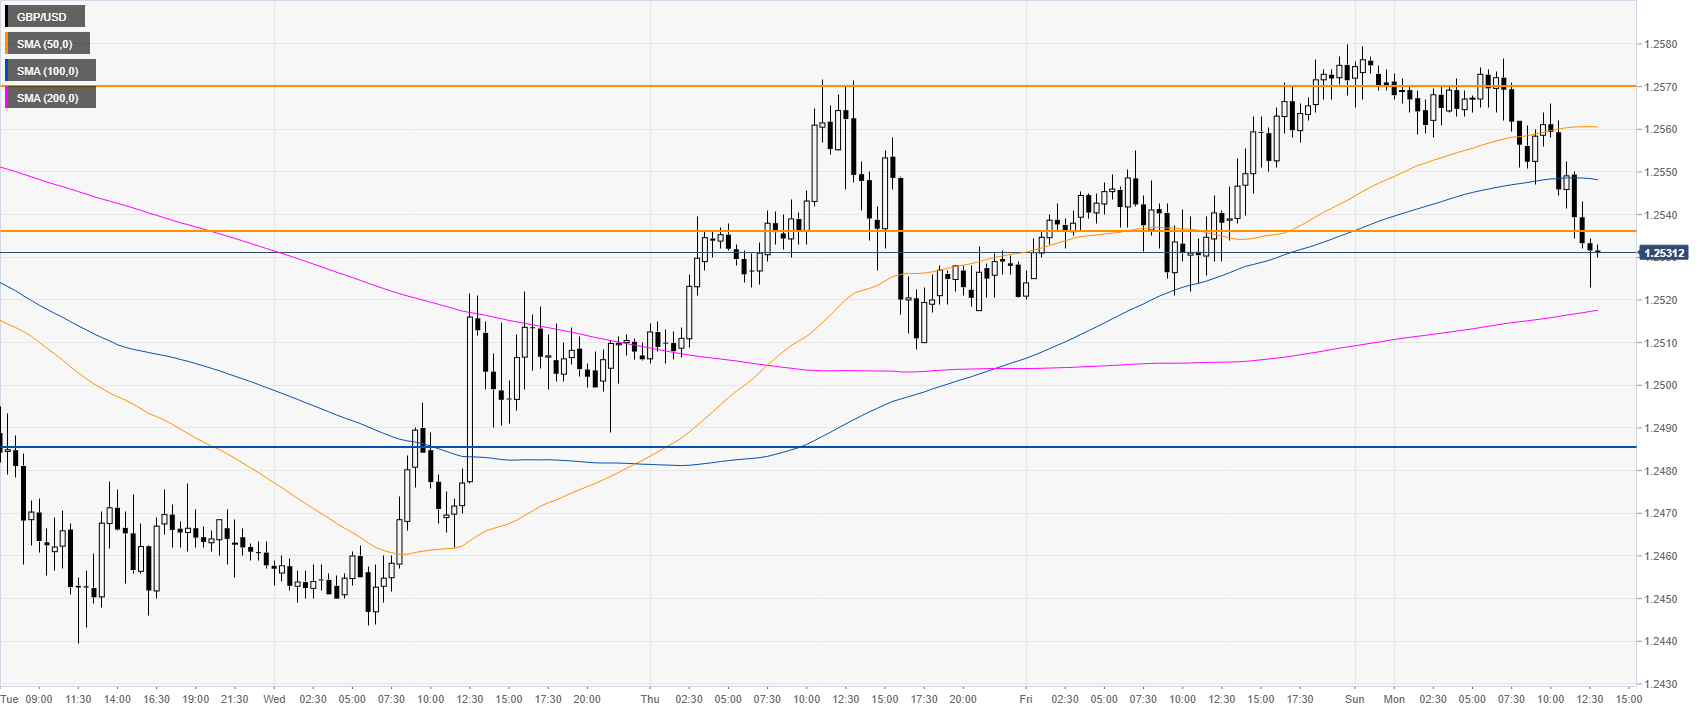
GBP/USD 30-minute chart
GBP/USD is trading between the 100 and 200 SMAs suggesting a correction in the near term. Resistance is seen at 1.2536 and 1.2570, according to the Technical Confluences Indicator.
Additional key levels
