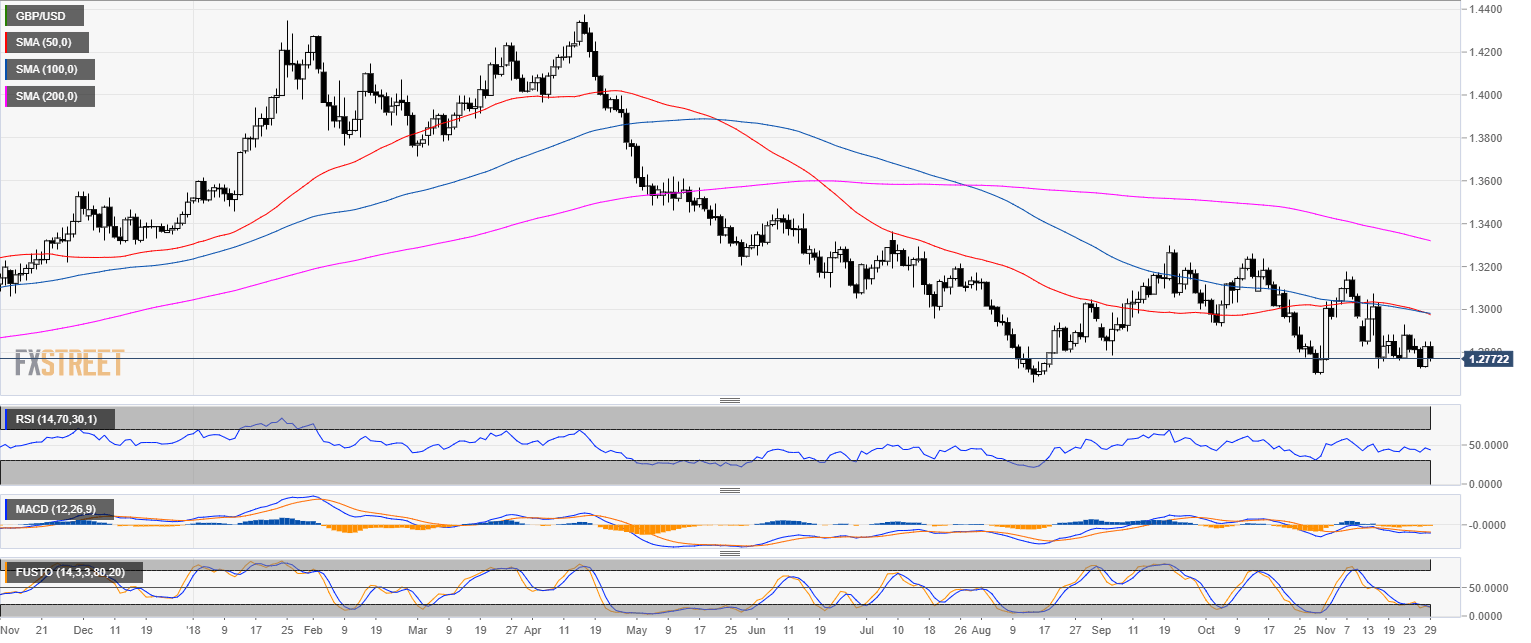
GBP/USD daily chart
- GBP/USD is evolving in a bear trend below the 200-day simple moving average (SMA).
- GBP/USD is in a tight trading range for the 9th consecutive day.
- The FOMC minutes were basically a non-event with virtually no market reactions.
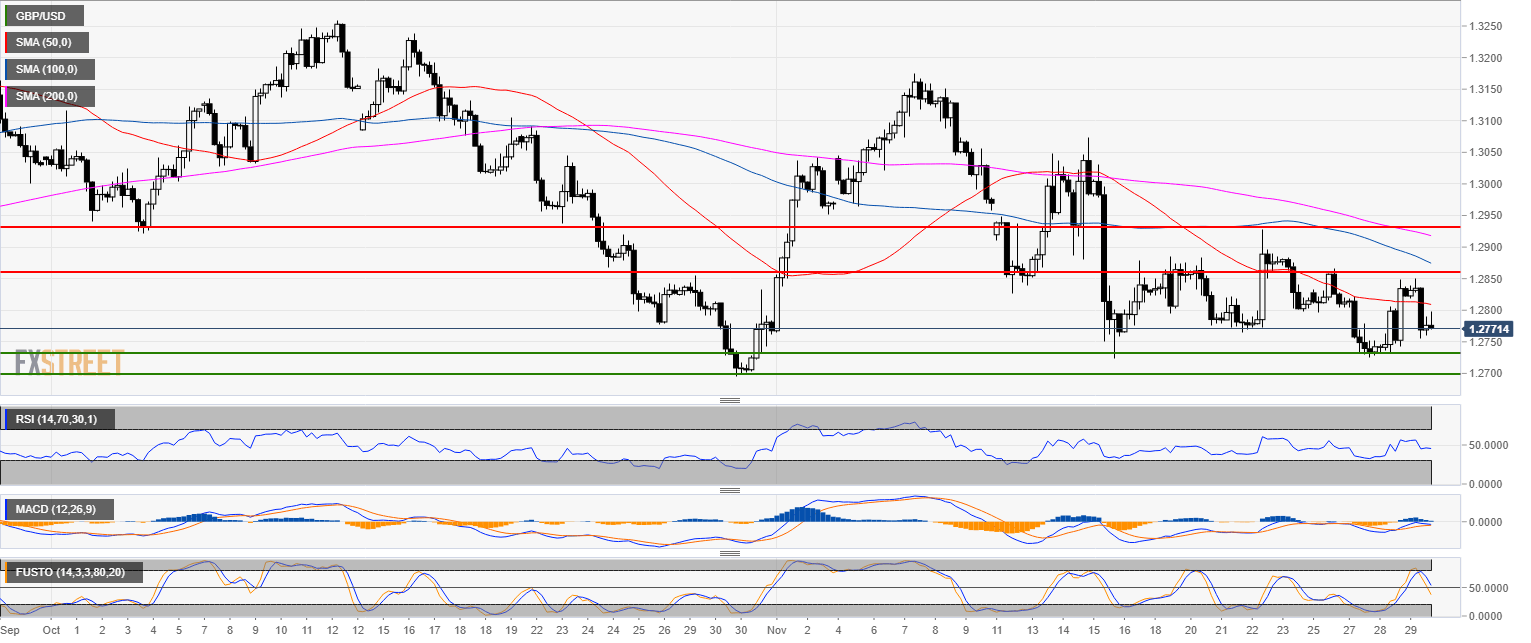
GBP/USD 4-hour chart
- GBP/USD has found support above the 1.2750 level.
- Technical indicators are supportive for higher prices ahead.
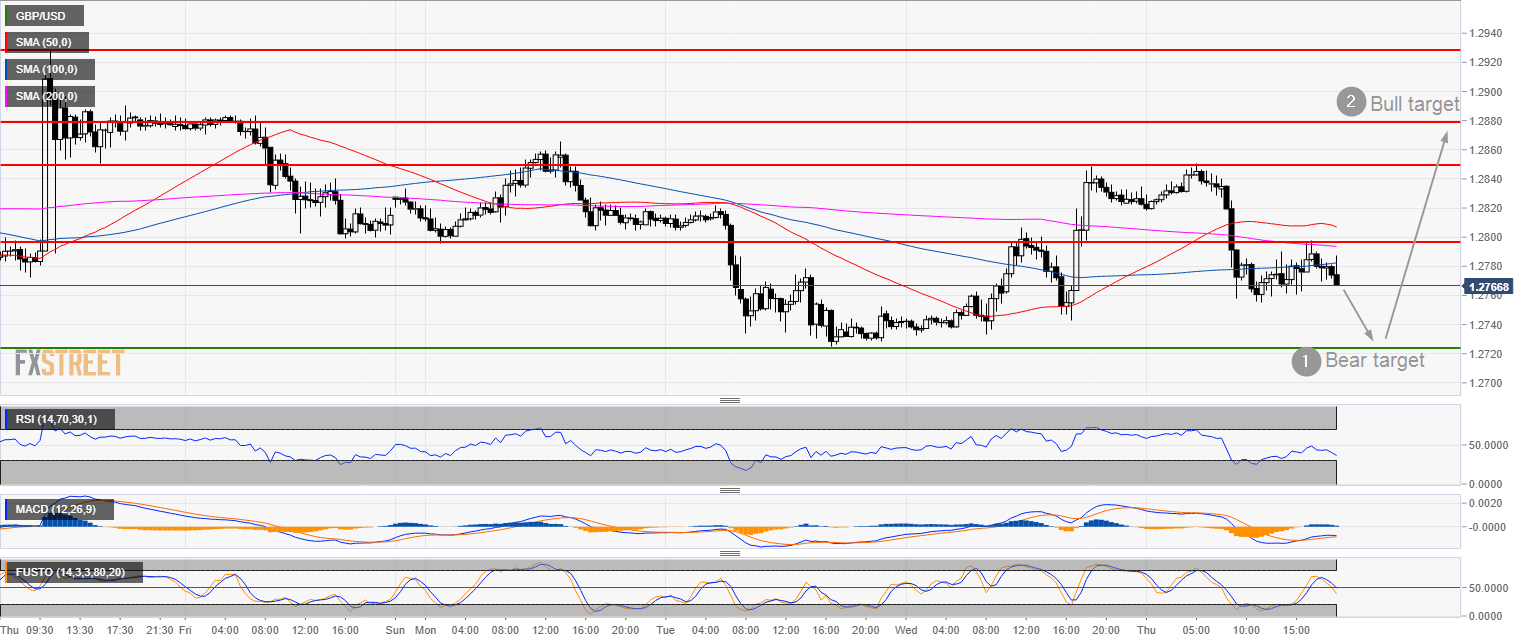
GBP/USD 30-minute chart
- GBP/USD could test Wednesday lows.
- If Wednesday’s low is tested and holds it can be a potential buy opportunity to target 1.2880 to the upside.
Additional key levels
GBP/USD
Overview:
Today Last Price: 1.2775
Today Daily change: -51 pips
Today Daily change %: -0.398%
Today Daily Open: 1.2826
Trends:
Previous Daily SMA20: 1.2909
Previous Daily SMA50: 1.2986
Previous Daily SMA100: 1.2986
Previous Daily SMA200: 1.3329
Levels:
Previous Daily High: 1.2848
Previous Daily Low: 1.2728
Previous Weekly High: 1.2928
Previous Weekly Low: 1.2764
Previous Monthly High: 1.326
Previous Monthly Low: 1.2696
Previous Daily Fibonacci 38.2%: 1.2802
Previous Daily Fibonacci 61.8%: 1.2774
Previous Daily Pivot Point S1: 1.2753
Previous Daily Pivot Point S2: 1.2681
Previous Daily Pivot Point S3: 1.2634
Previous Daily Pivot Point R1: 1.2873
Previous Daily Pivot Point R2: 1.292
Previous Daily Pivot Point R3: 1.2992
