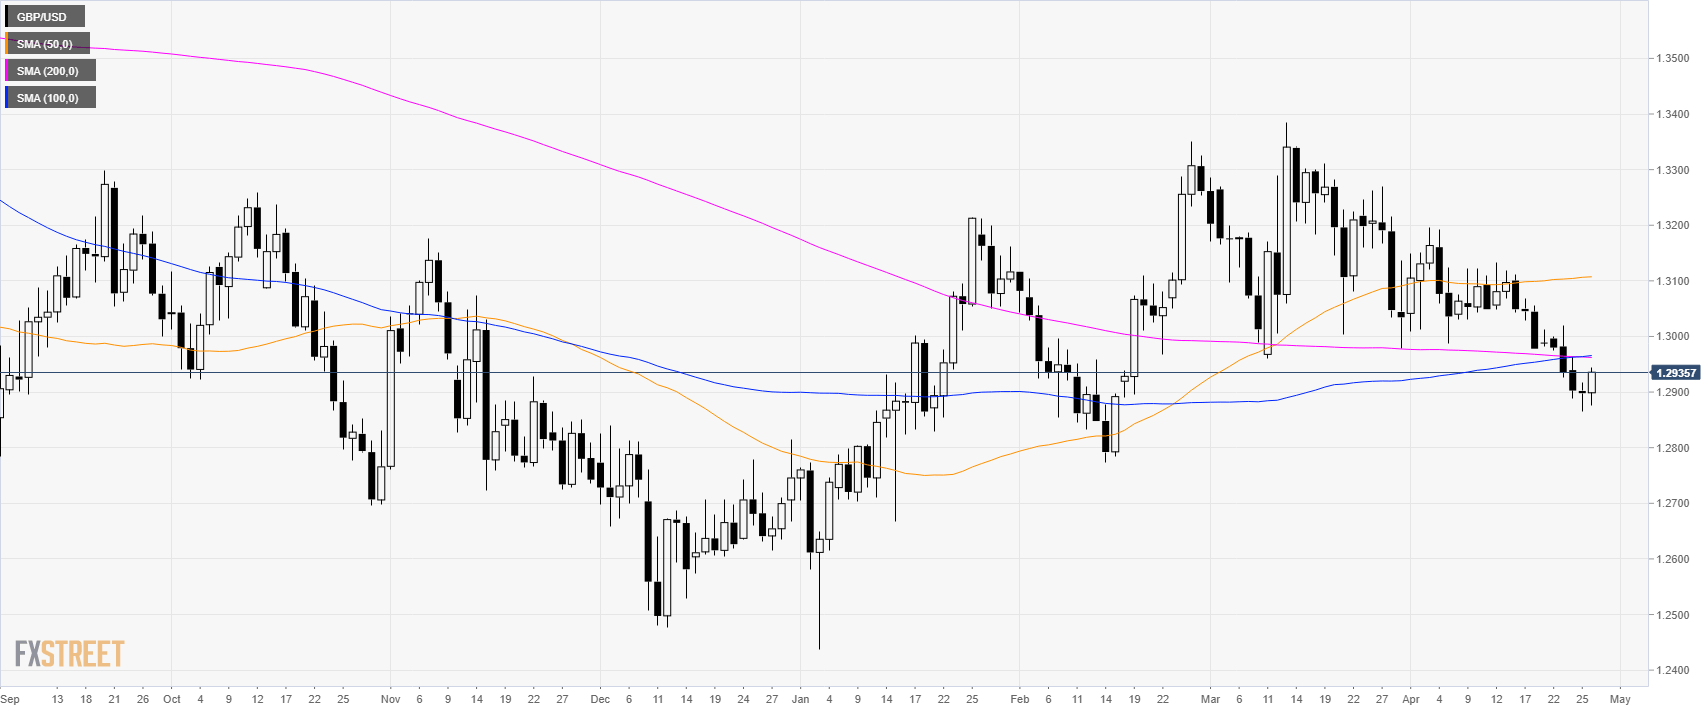
Home GBP/USD Technical Analysis: Cable trading above 1.2900 figure among Dollar weakness
FXStreet News

GBP/USD Technical Analysis: Cable trading above 1.2900 figure among Dollar weakness

GBP/USD daily chart

  • GBP/USD is regaining some strength above 1.2900 as the US Dollar is weakening across the board.

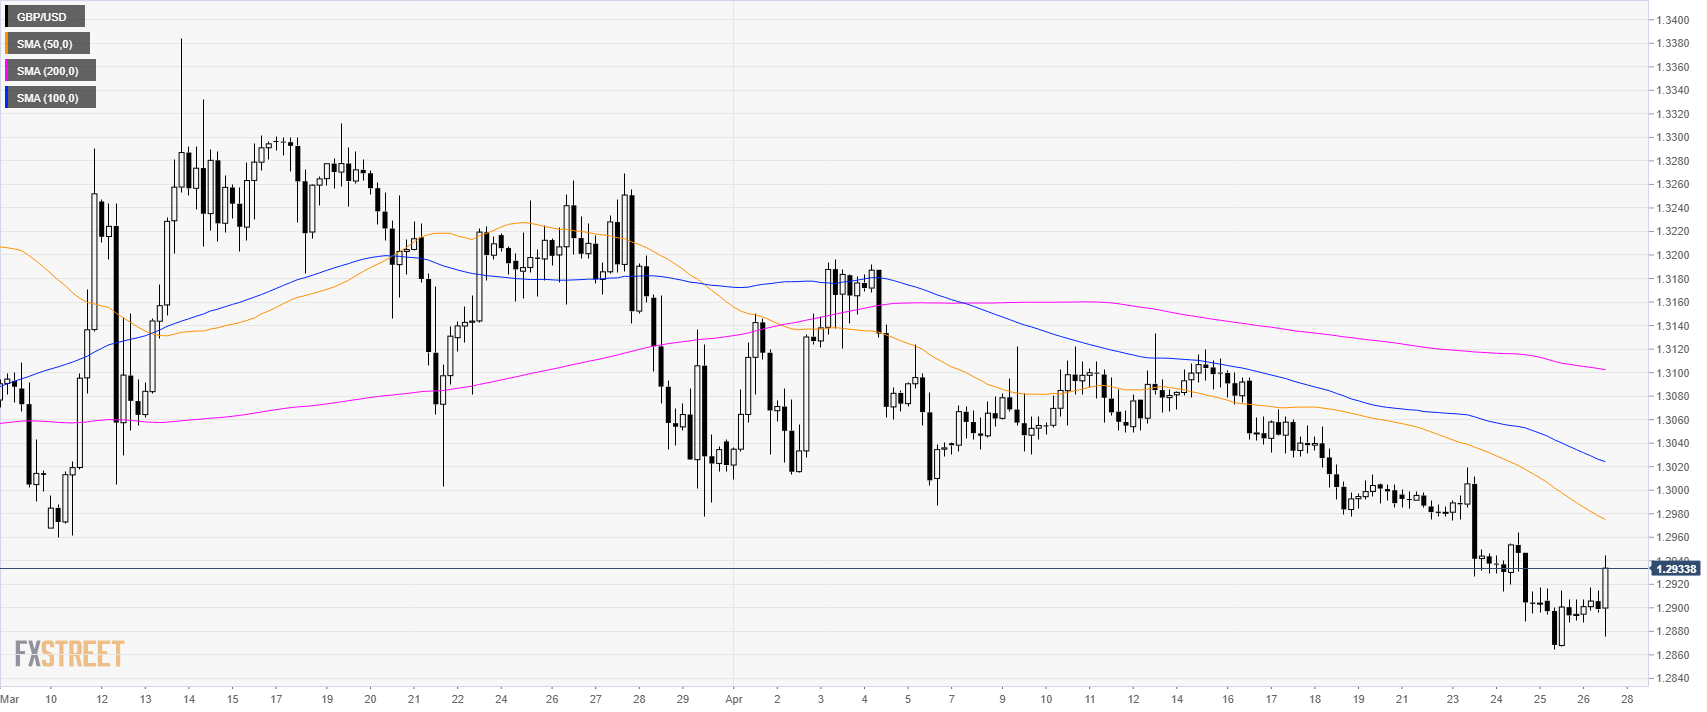
GBP/USD 4-hour chart

  • GBP/USD is trading below its main SMAs suggesting bearish momentum in the medium-term.


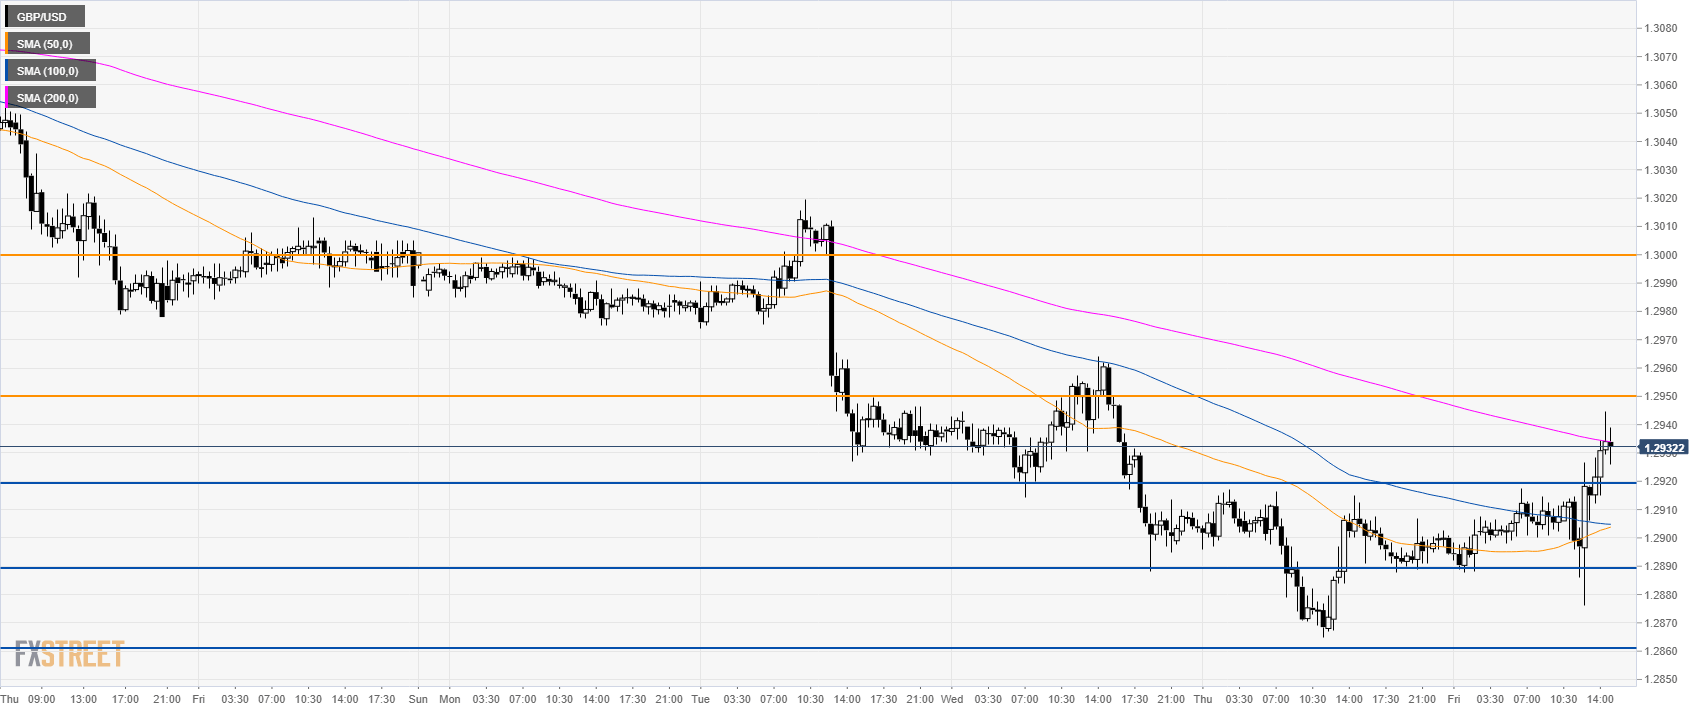
GBP/USD 30-minute chart

  • GBP/USD broke above 1.2920 and the 50 and 100 SMAs suggesting a correction up.
  • If bulls break 1.2950 then 1.3000 the figure can come into play.
  • Support is seen at 1.2920, 1.2890 and 1.2860 level.

Additional key levels


FX Street

FX Street

FXStreet is the leading independent portal dedicated to the Foreign Exchange (Forex) market. It was launched in 2000 and the portal has always been proud of their unyielding commitment to provide objective and unbiased information, to enable their users to take better and more confident decisions.