- GBP/USD is trading mixed this week revolving around the 1.2300 handle.
- The level to beat for bulls is the 1.2330 resistance.
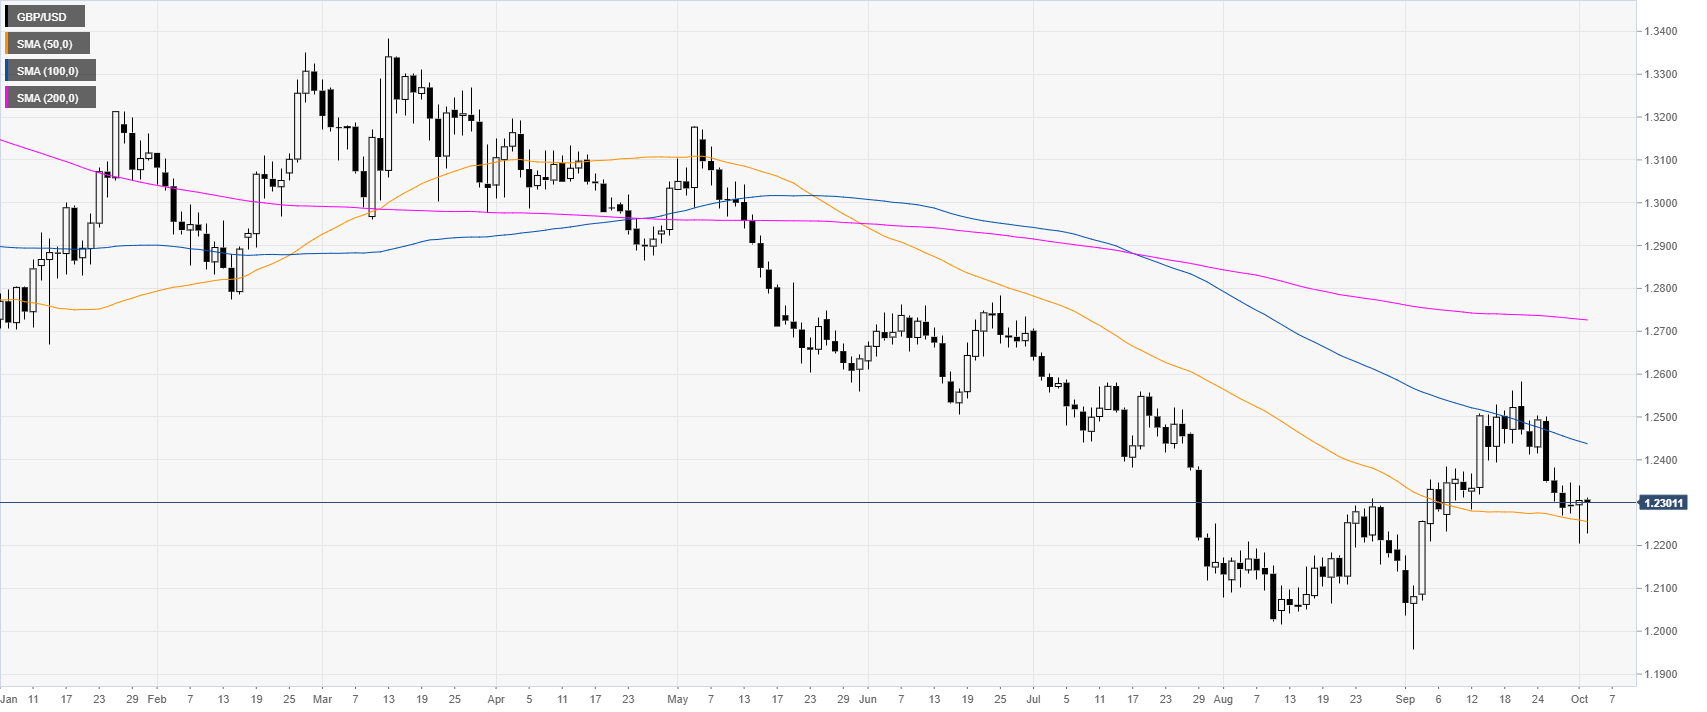
GBP/USD daily chart
The Sterling is trading in a downtrend below the 100 and 200-day simple moving averages (DSMAs). In the New York session, the ADP, the forerunner of the Nonfarm Payrolls on Friday disappointed with only 135k vs. 140k expected in September. UK PM Johnson did not provide details on the Brexit plan as negotiations keep going in Brussels.
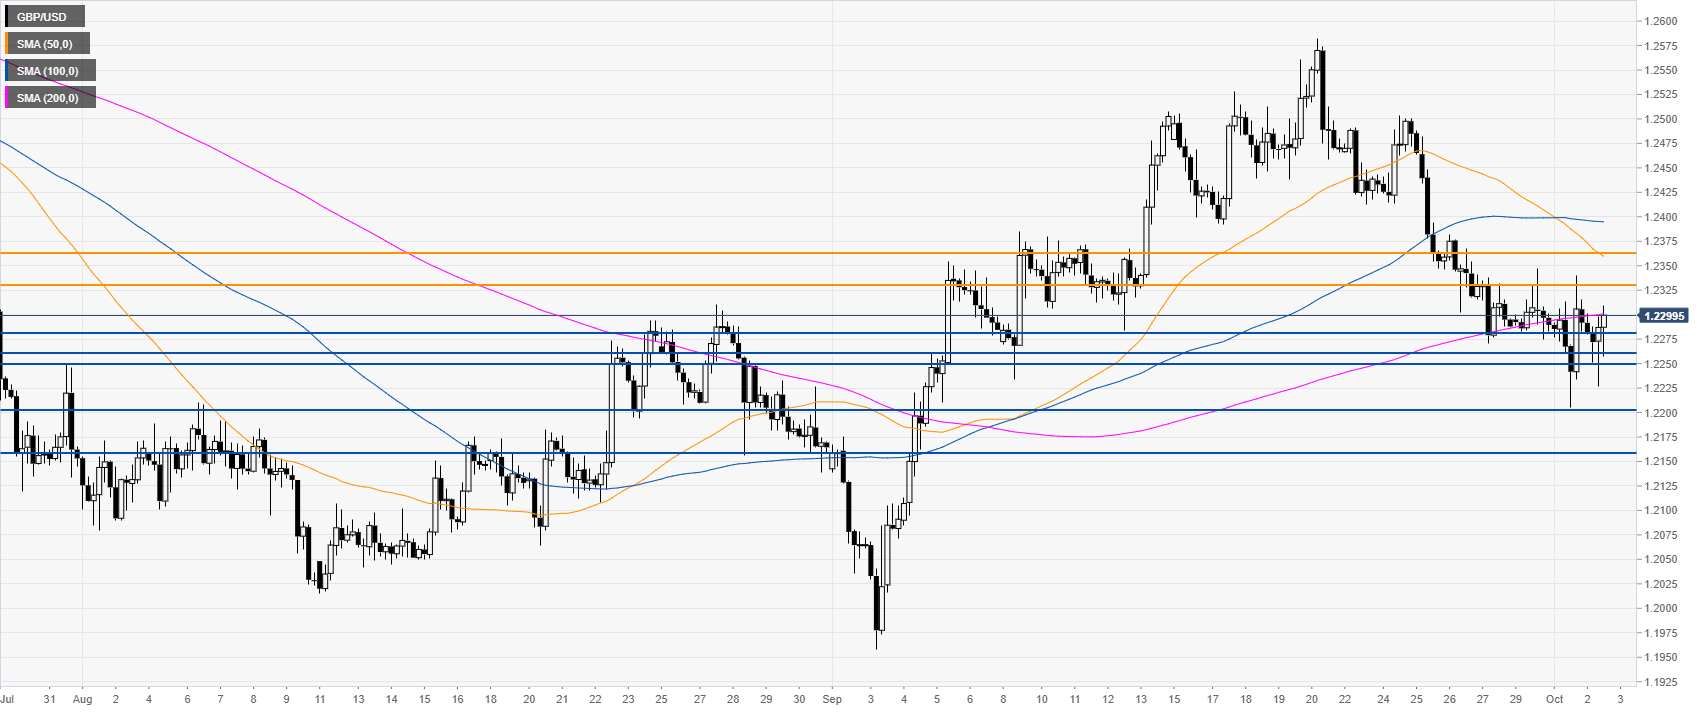
GBP/USD four-hour chart
GBP/USD is challenging the 200 SMAs, suggesting a neutral bias in the medium term. A break below the 1.2200 level is necessary to open the gates to 1.2157, according to the Technical Confluences Indicator.
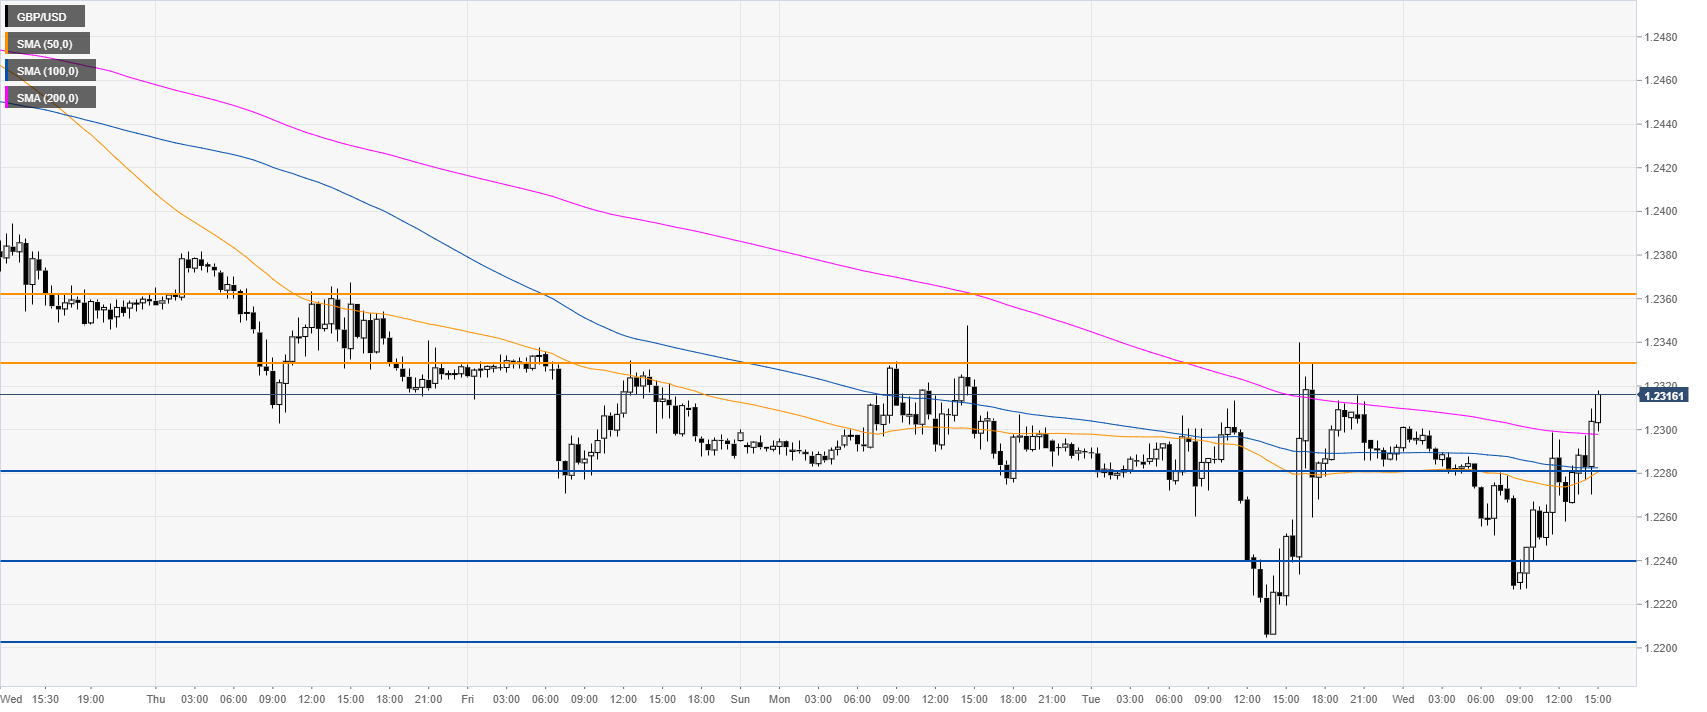
GBP/USD 30-minute
The Pound/US Dollar exchange rate is trading above the main SMAs on the 30-minute chart, suggesting a bullish bias in the short term. A break above 1.2330 can expose 1.2360 resistance. Immediate supports are seen at the 1.2280 and 1.2240 levels, according to the Technical Confluences Indicator.
Additional key levels
