- GBP/USD is easing from daily highs after the London close.
- The level to beat for buyers is the 1.2420 resistance.
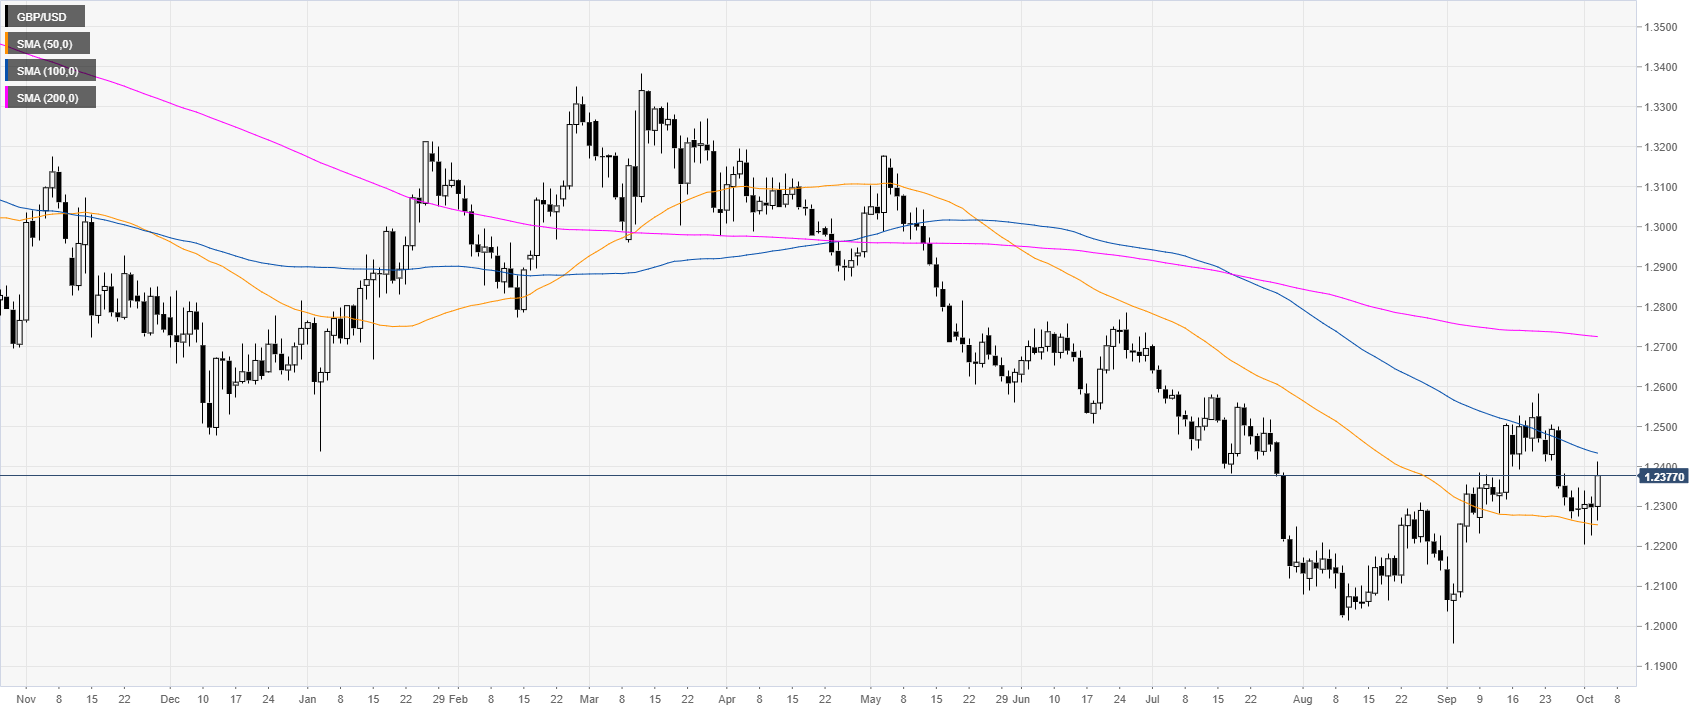
GBP/USD daily chart
The Sterling is trading in a downtrend below its 100 and 200-day simple moving averages (DSMAs). US weakness and positive Brexit news gave GBP/USD a boost this Thursday.
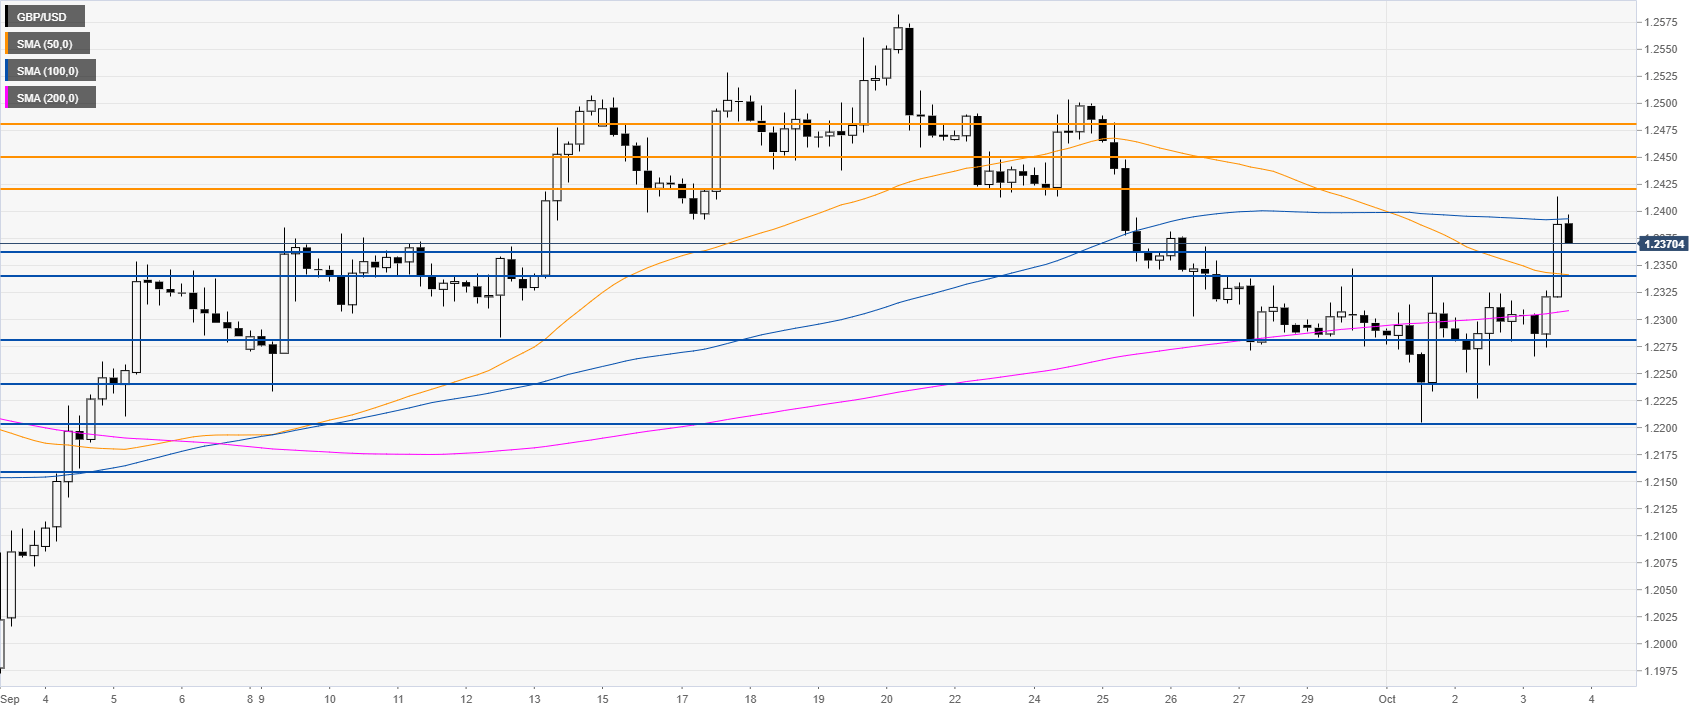
GBP/USD four-hour chart
GBP/USD is trading above the 50 and 200 SMAs, suggesting a bullish bias in the medium term. A break above 1.2420 and the 100 SMA would expose the 1.2450 and 1.2480 resistances, according to the Technical Confluences Indicator.
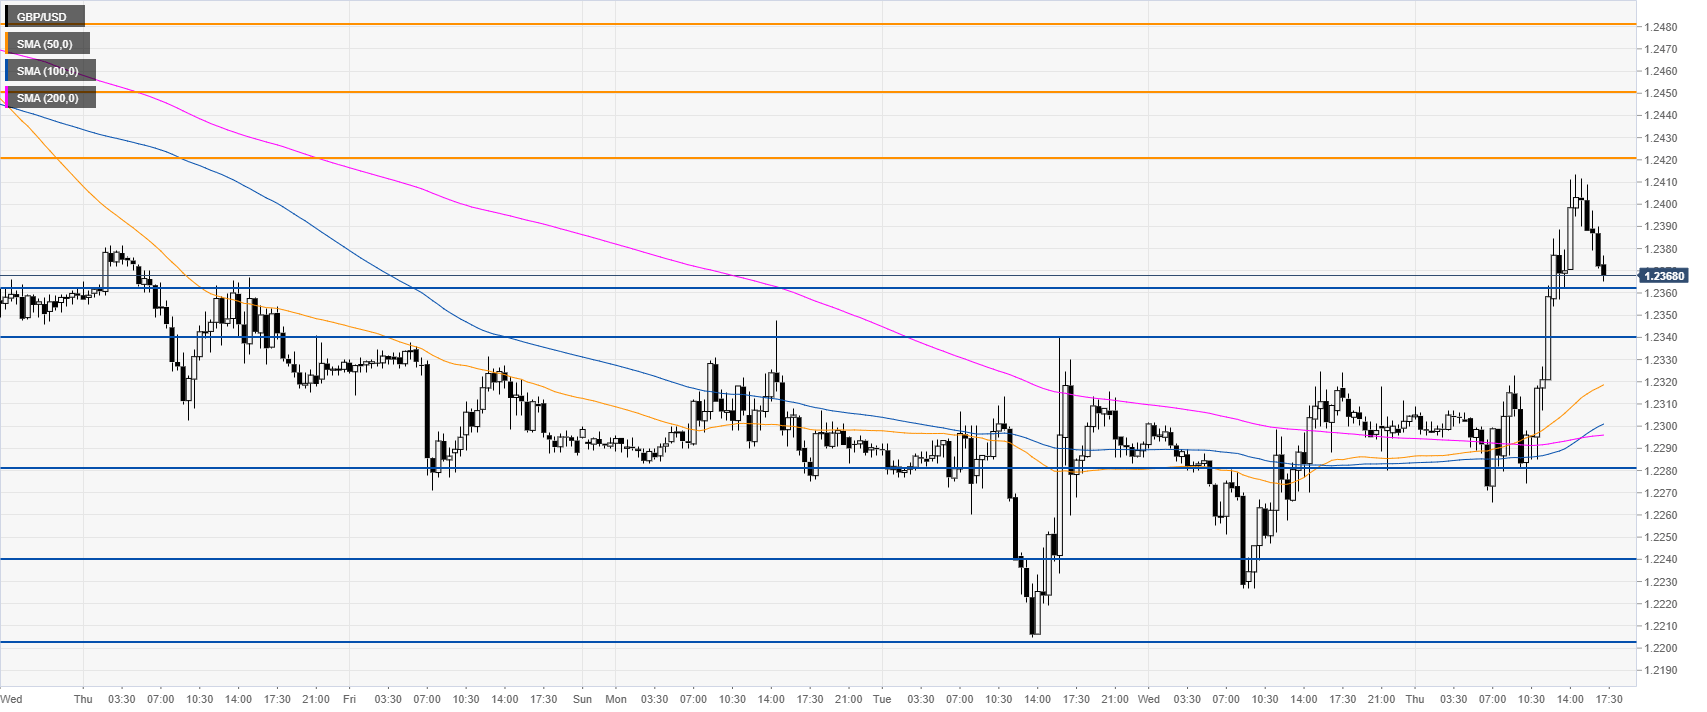
GBP/USD 30-minute
The Pound/US Dollar exchange rate is trading above the main SMAs on the 30-minute chart, suggesting a bullish bias in the short term. Immediate supports are seen at the 1.2360 and 1.2340 levels, according to the Technical Confluences Indicator.
Additional key levels
