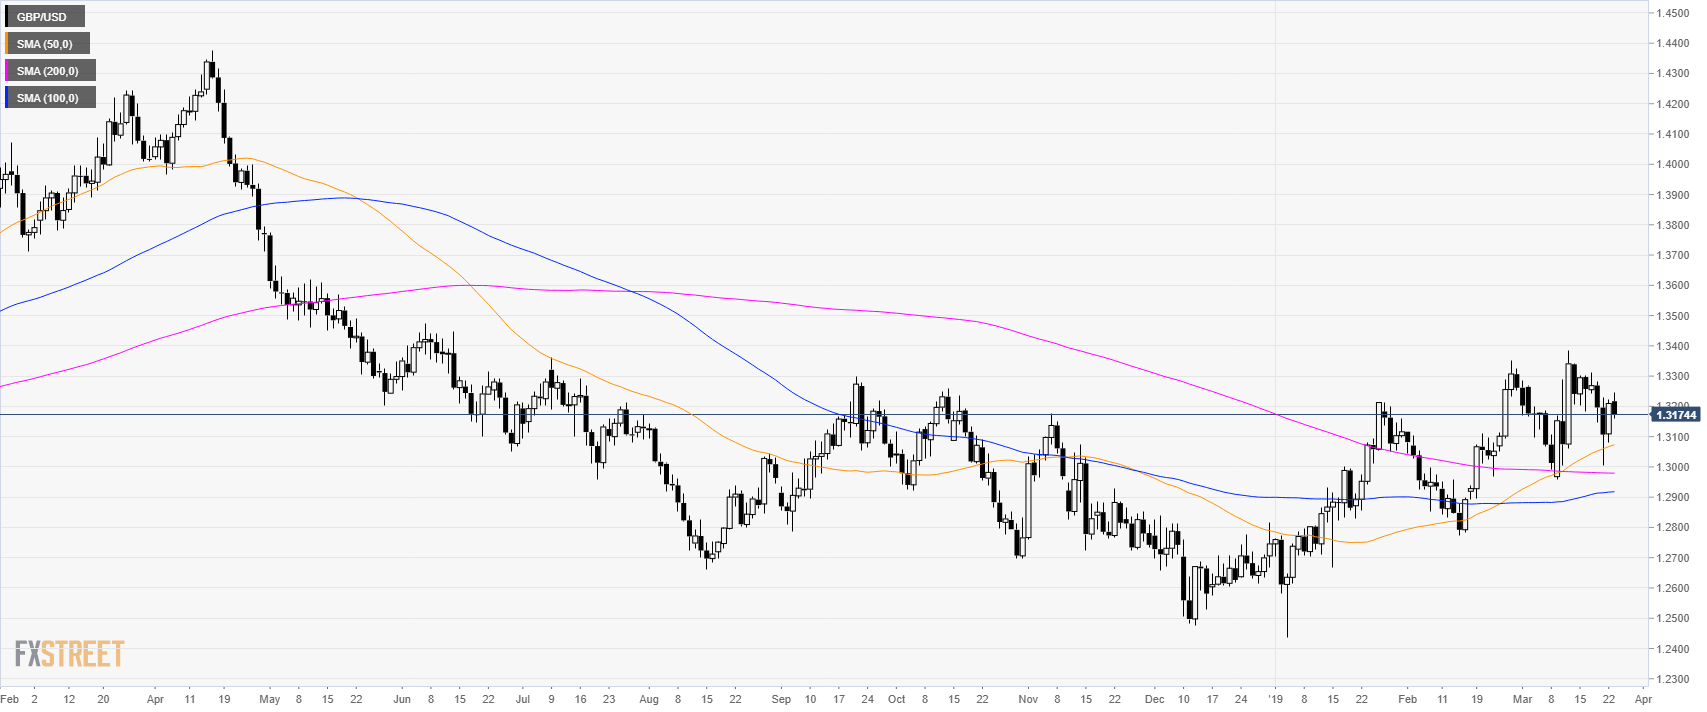
Home GBP/USD Technical Analysis: Cable trading below 1.3200 figure
FXStreet News

GBP/USD Technical Analysis: Cable trading below 1.3200 figure

GBP/USD daily chart

  • GBP/USD is trading in a bull trend above its main simple moving averages (SMAs).

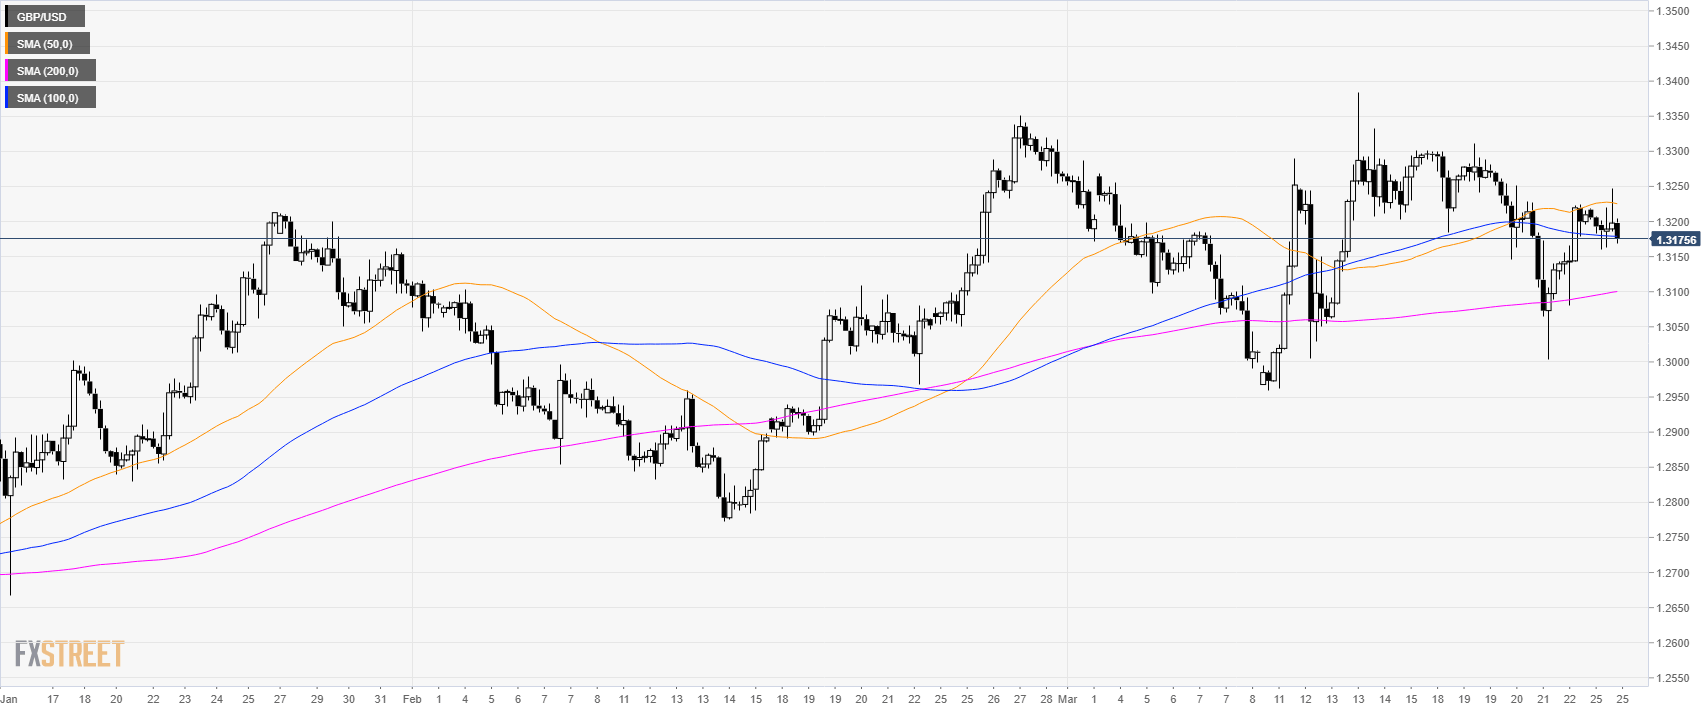
GBP/USD 4-hour chart

  • GBP/USD is trading below the 50 and 100 SMAs suggesting a consolidation phase.  


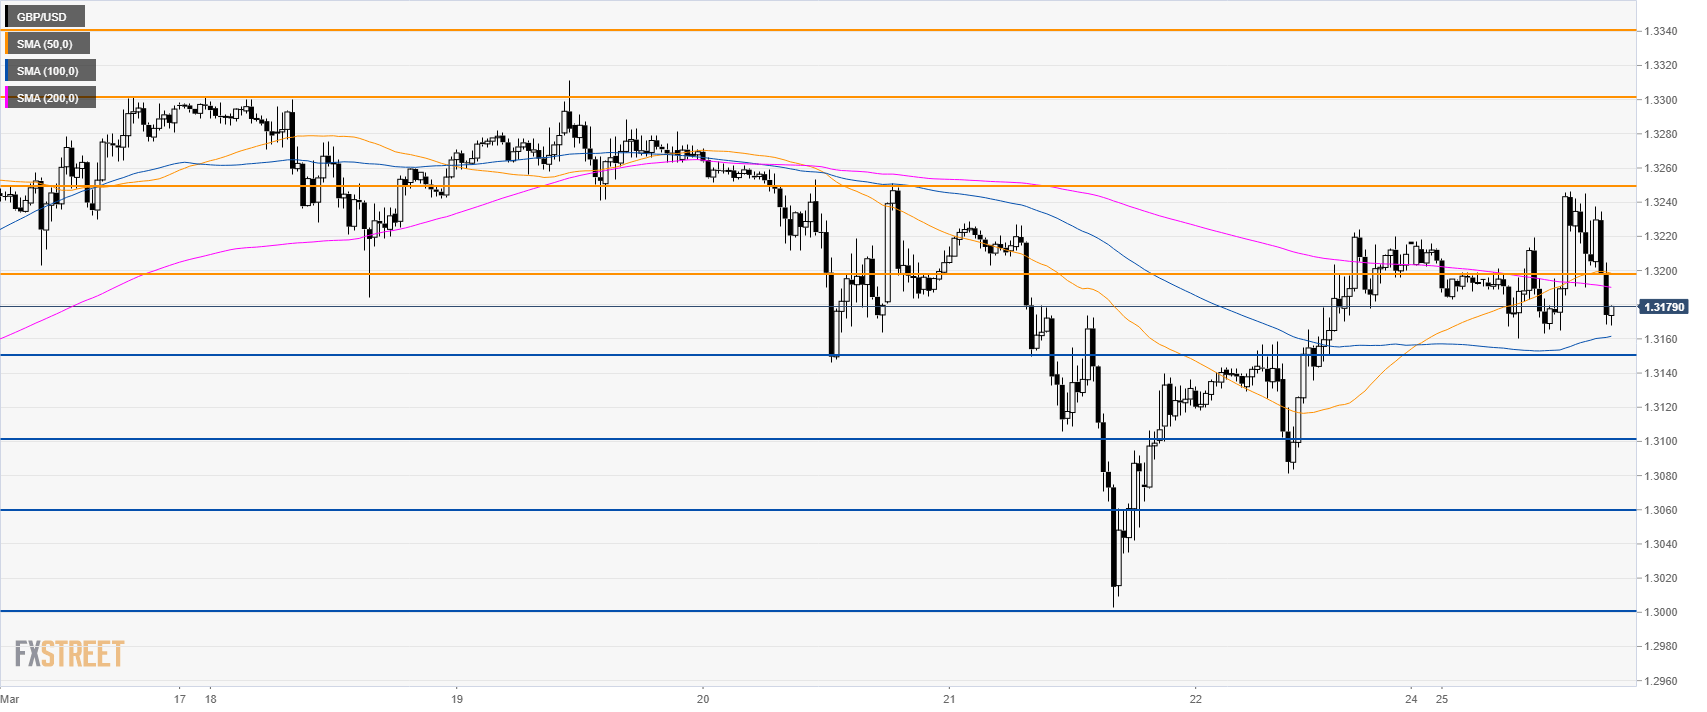
GBP/USD 30-minute chart

  • GBP/USD is trading below the 1.3200 figure and the 200 SMA.
  • A break below 1.3150 is needed for a decline to 1.3100 and 1.3000 figure.
  • Resistances are at 1.3200 and 1.3250 level.

Additional key levels


FX Street

FX Street

FXStreet is the leading independent portal dedicated to the Foreign Exchange (Forex) market. It was launched in 2000 and the portal has always been proud of their unyielding commitment to provide objective and unbiased information, to enable their users to take better and more confident decisions.