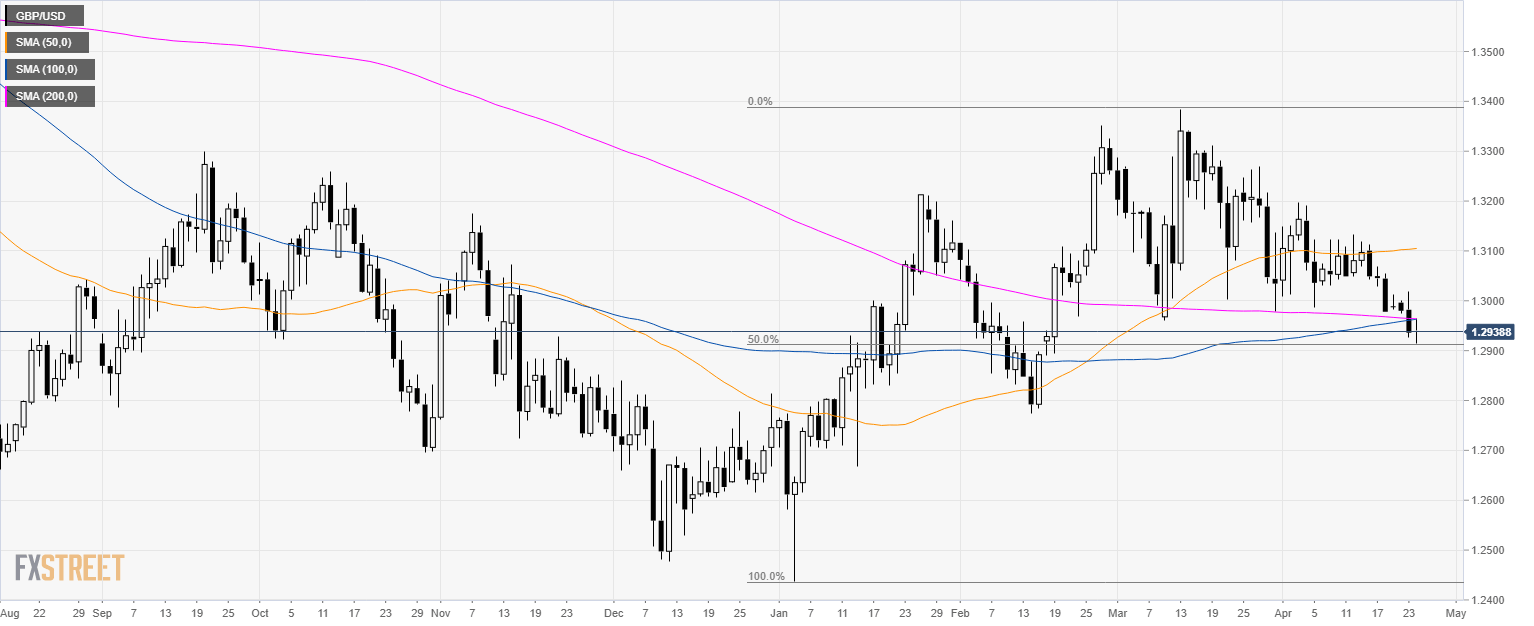
GBP/USD daily chart
- GBP/USD is trading in the middle of its year-to-date (YTD) range as the market retraced 50% from the January-March swing up.
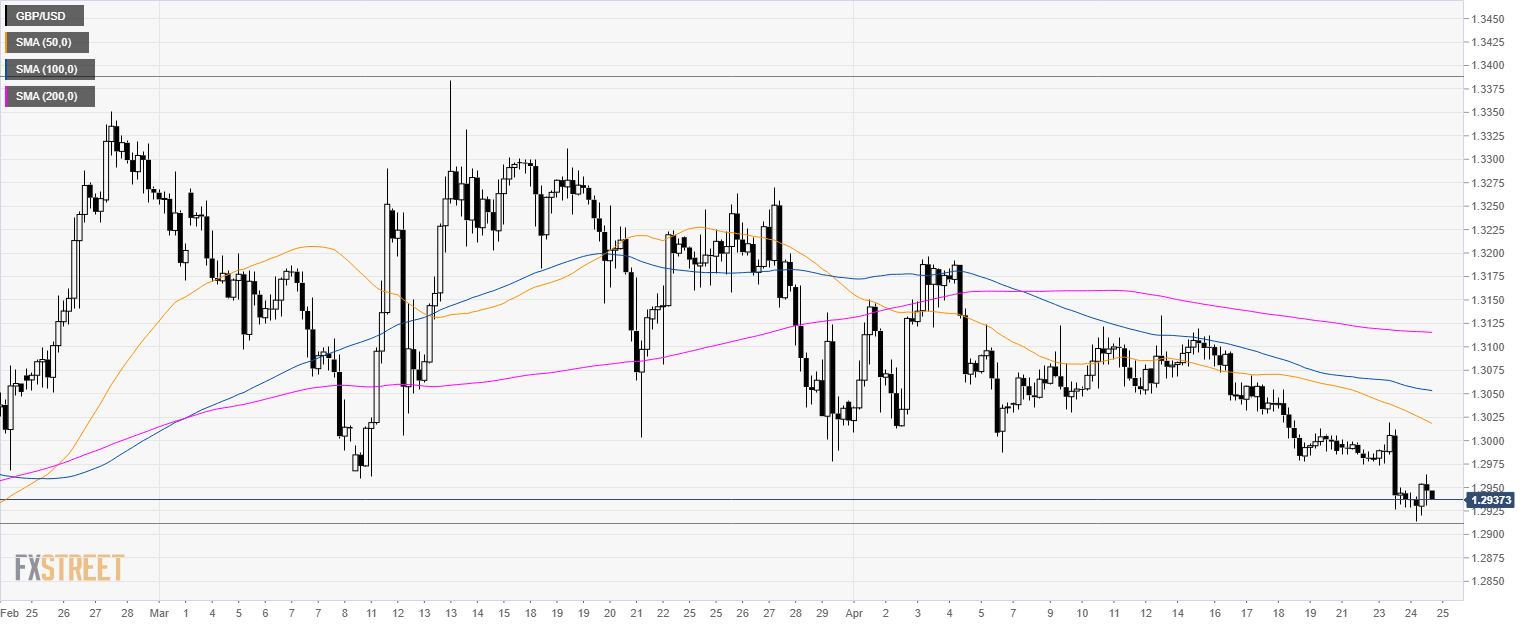
GBP/USD 4-hour chart
- GBP/USD is trading below its main SMAs suggesting a bearish momentum in the medium-term.
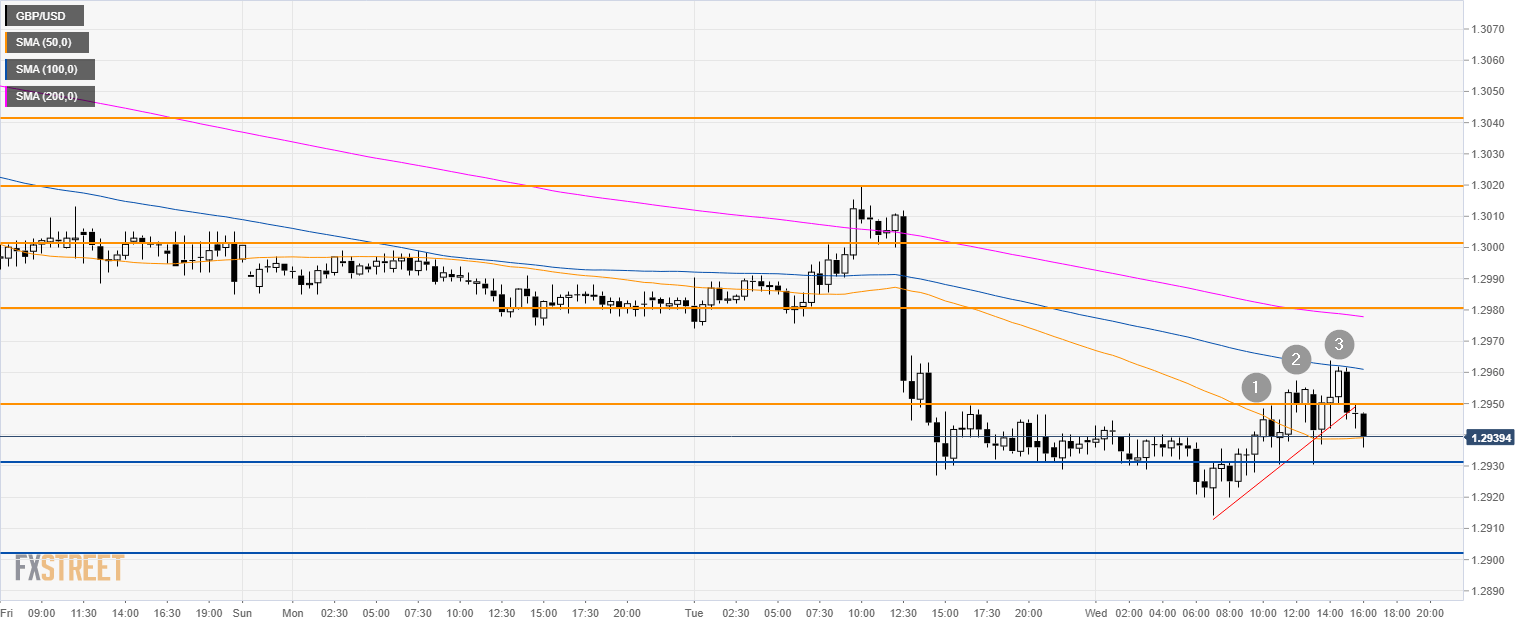
GBP/USD 30-minute chart
- The market is trading below its 100 and SMAs suggesting a bearish bias in the short-term.
- Bulls made three attempts to break above 1.2950 but they were capped by the 100 SMA.
- GBP/USD continues to trade on the defensive with 1.2930 and 1.2900 acting as main intraday support to the downside.
Additional key levels
