- GBP/USD is consolidating Tuesday’s losses near the 1.2900 handle.
- The level to beat for bears is the 1.2815 support.
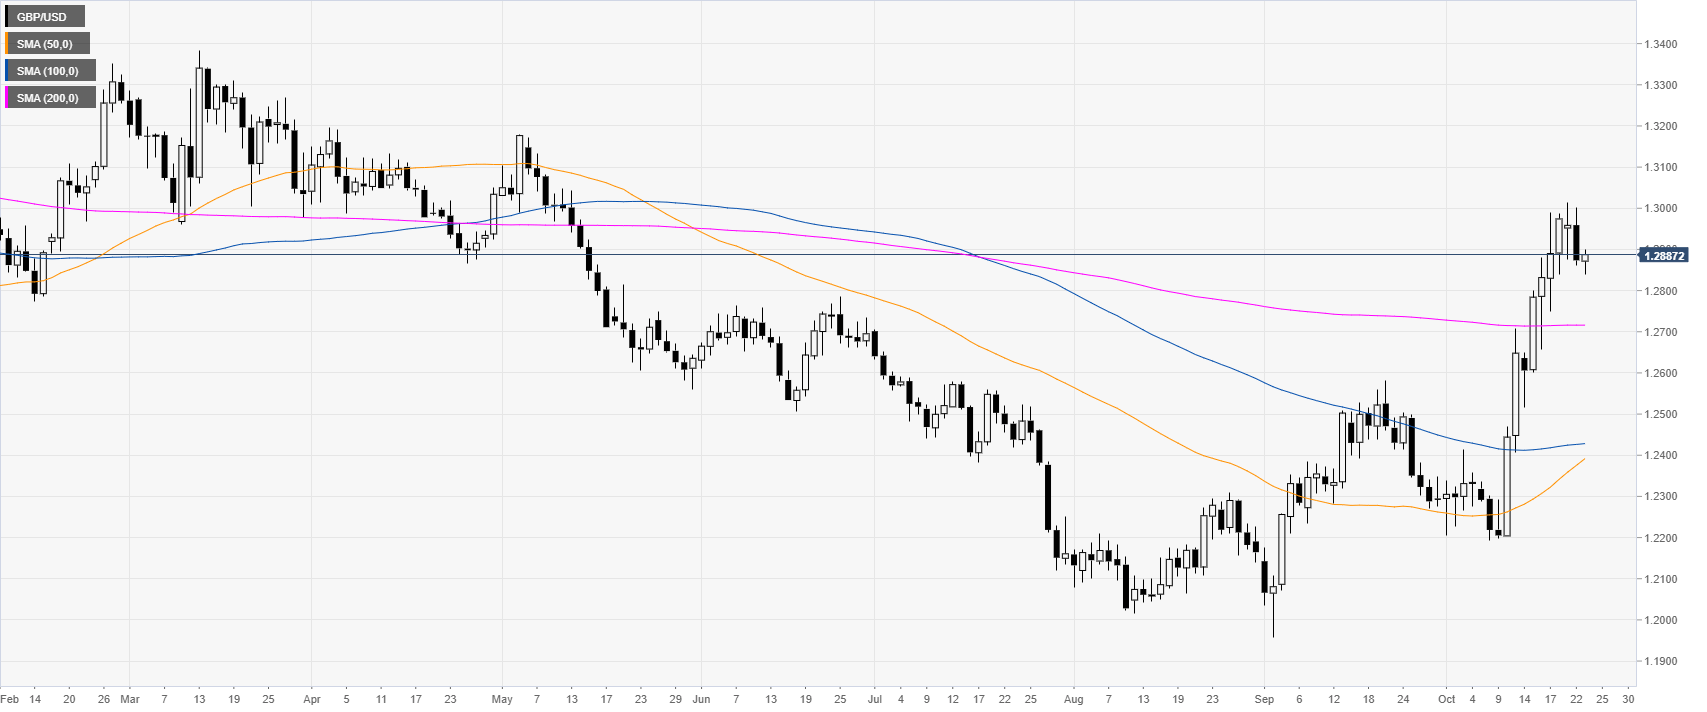
GBP/USD daily chart
The Pound, on the daily chart, had a spike above the main daily simple moving averages (DSMAs) while hitting levels not seen since mid-May 2019. The Brexit headlines remain the main drivers behind GBP/USD moves. UK PM Johnson spokesman: If EU offers January extension, there will need to be an election.
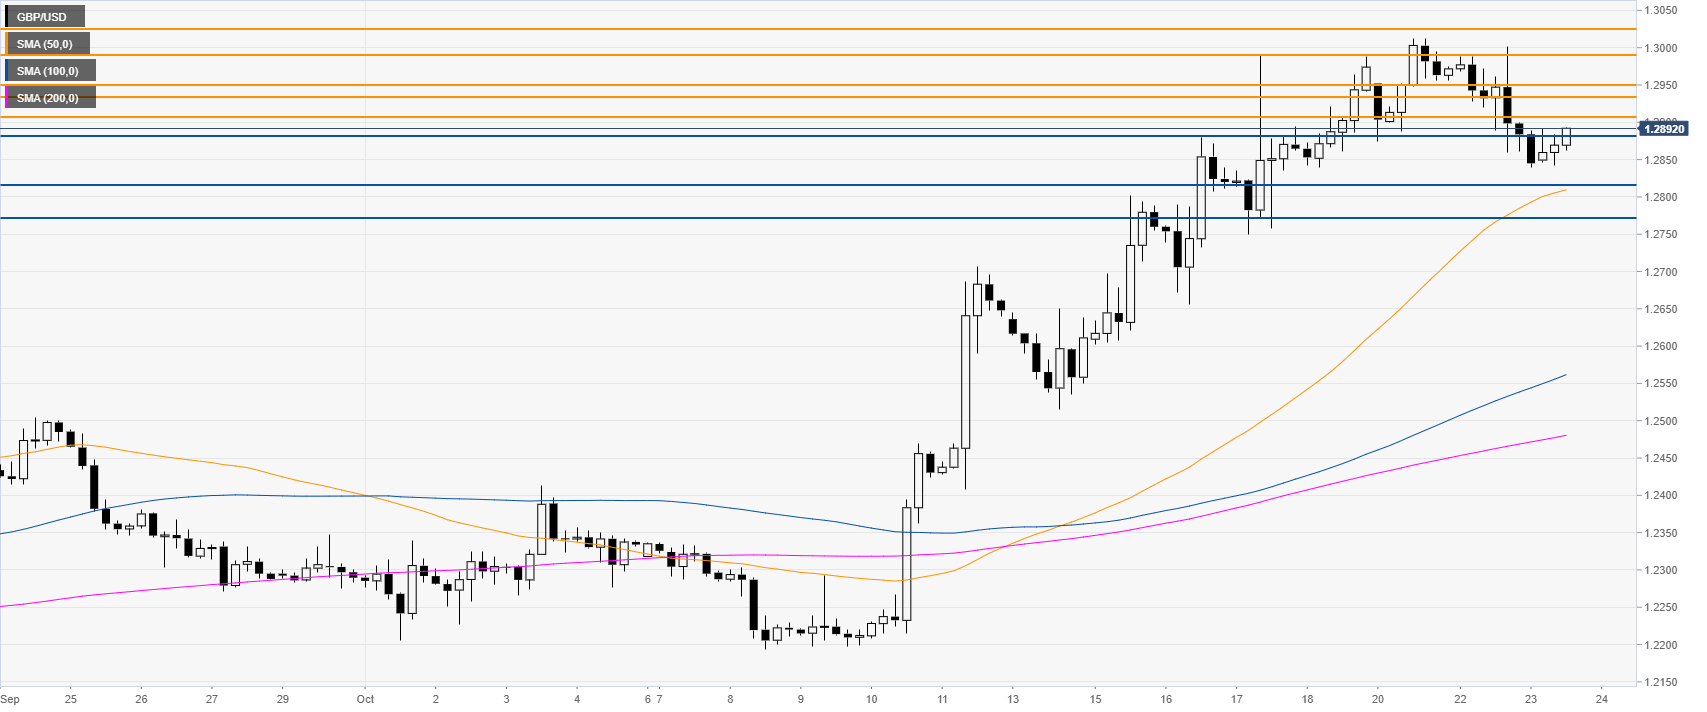
GBP/USD four-hour chart
The Cable is trading in a bull channel above the main SMAs. After a pullback down, the market is now attempting to regain the 1.2900 handle. A break above 1.2908 can lead to further gains towards 1.2935/50 resistance zone, according to the Technical Confluences Indicator.
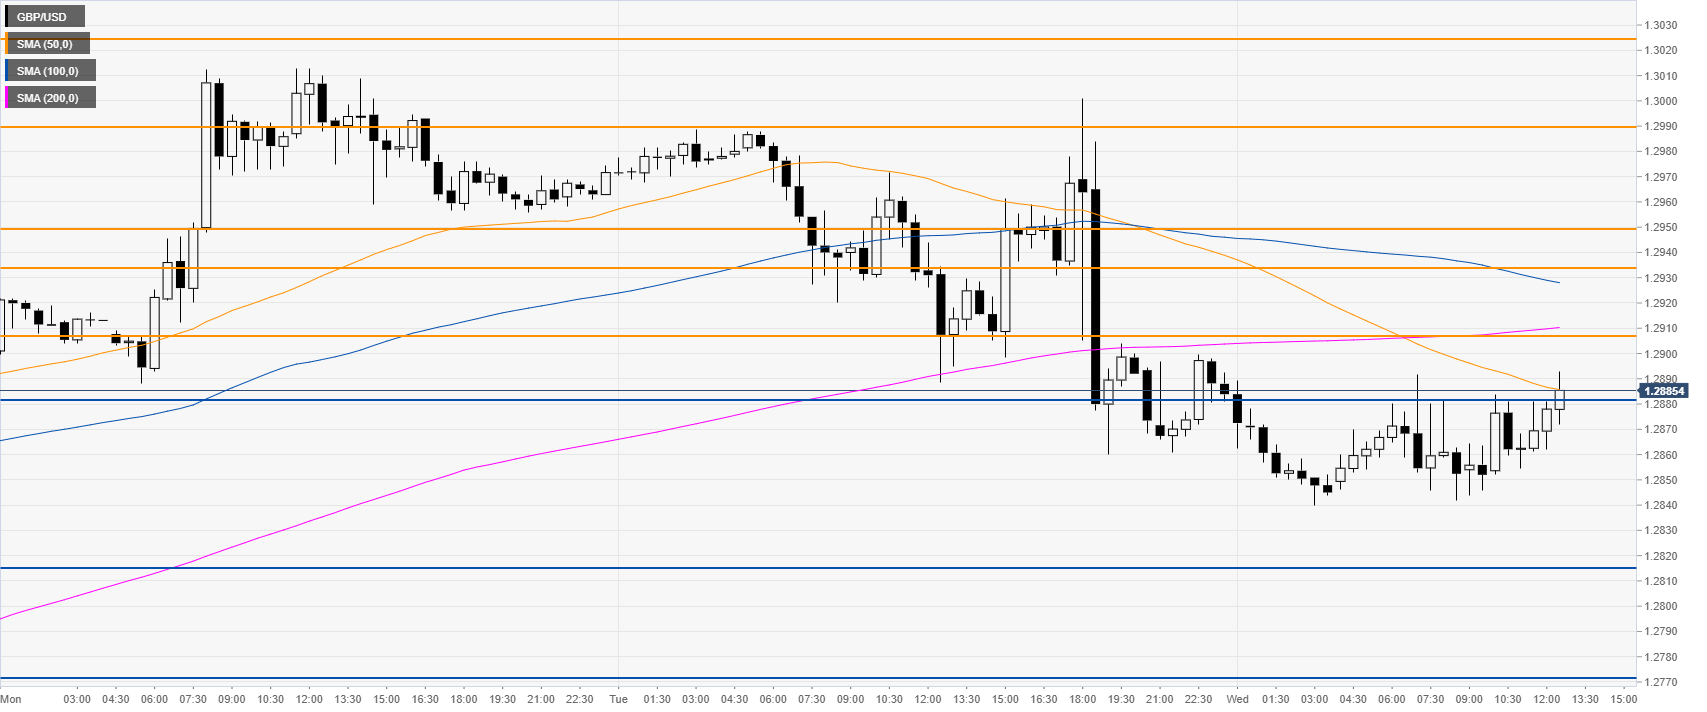
GBP/USD 30-minute chart
GBP/USD is trading below the 100 and 200 SMAs, suggesting a potential bearish momentum in the near term. Bears need to reclaim the 1.2880 level to trade towards the 1.2815 and 1.2772 support levels, according to the Technical Confluences Indicator.
Additional key levels
