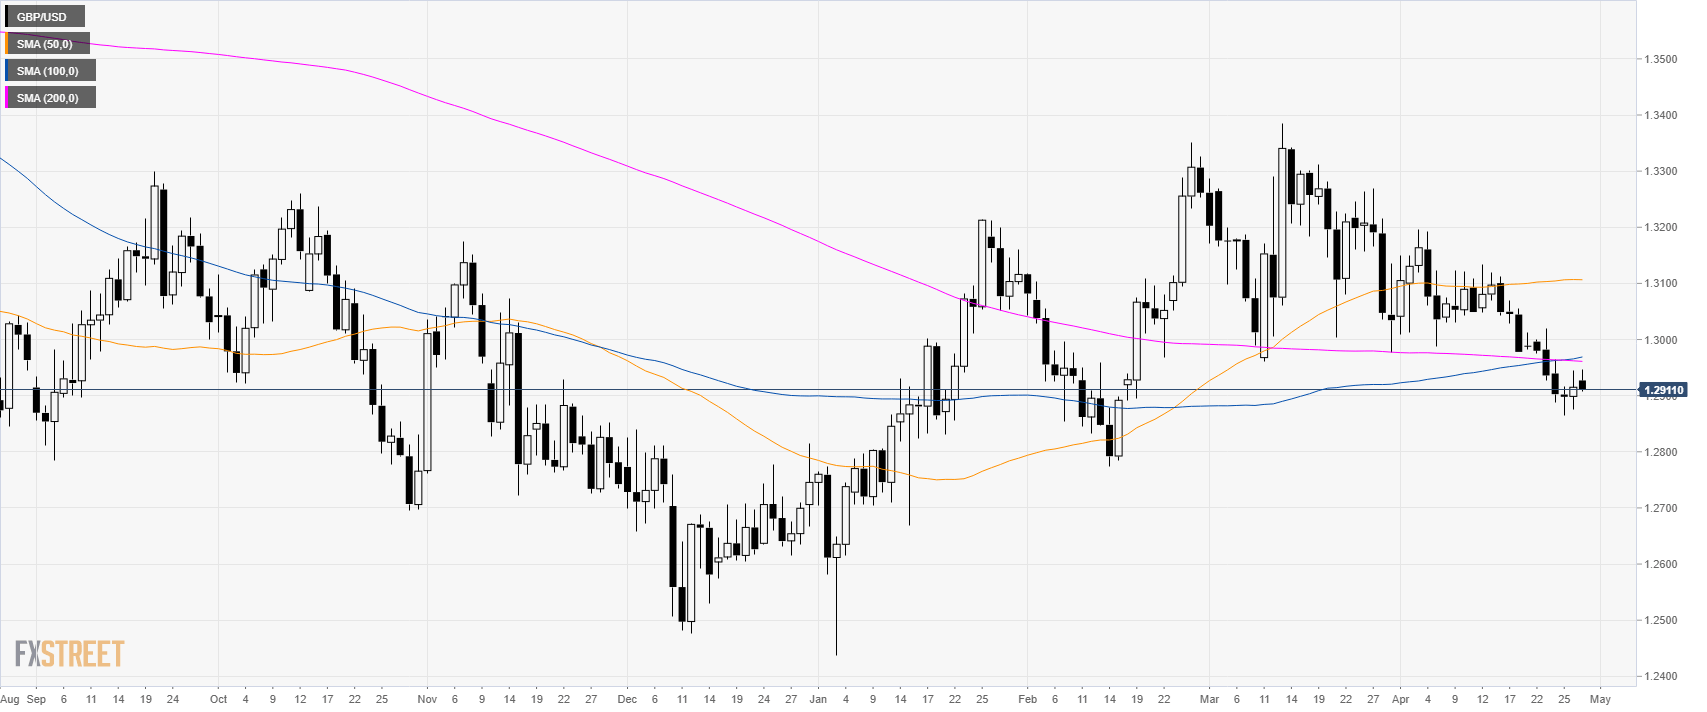
Home GBP/USD Technical Analysis: Cable under pressure near daily lows as market approaches 1.2900 figure
FXStreet News

GBP/USD Technical Analysis: Cable under pressure near daily lows as market approaches 1.2900 figure

GBP/USD daily chart

  • GBP/USD is trading below its main SMAs at 2.5-month lows.

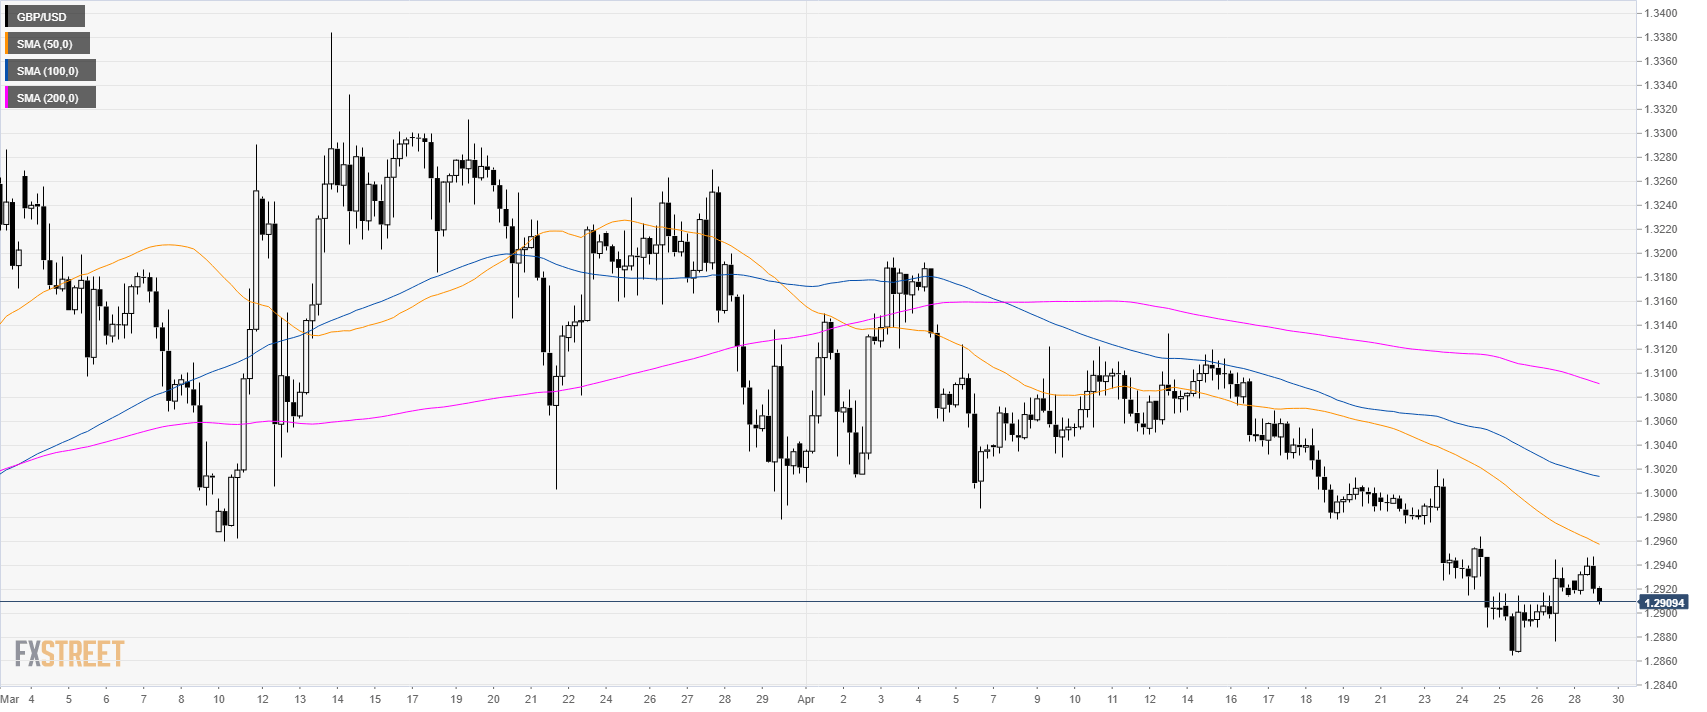
GBP/USD 4-hour chart

  • GBP/USD is trading below its main SMAs suggesting bearish momentum in the medium-term.

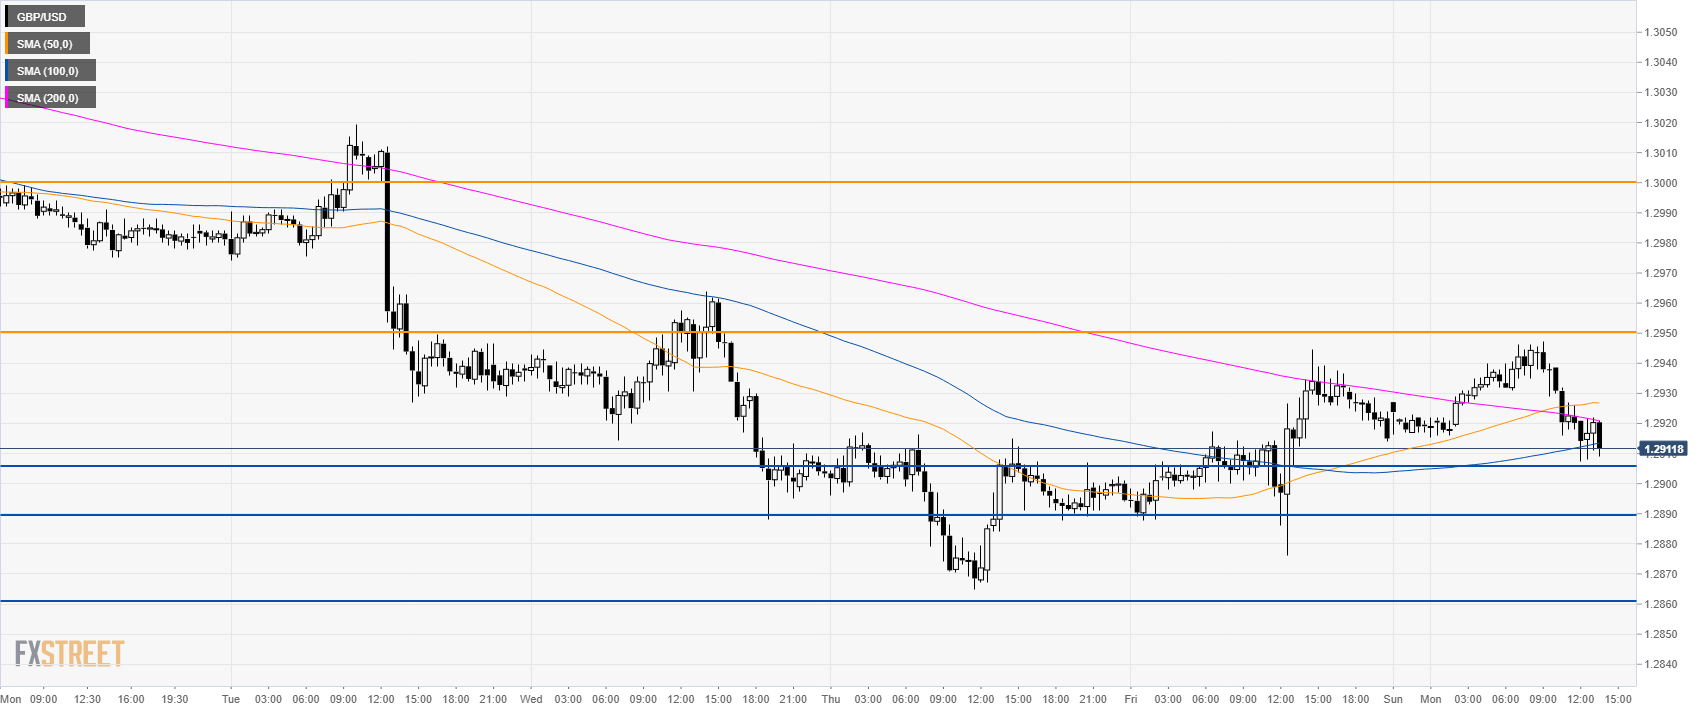
GBP/USD 30-minute chart

  • GBP/USD is trading below 1.2950 and its main SMAs suggesting a bearish bias in the short-term.
  • If bears break 1.2905 then 1.2890 and 1.2860 can come into play in the near-term.
  • Resistance is seen at 1.2950 and 1.3000 level.

Additional key levels


FX Street

FX Street

FXStreet is the leading independent portal dedicated to the Foreign Exchange (Forex) market. It was launched in 2000 and the portal has always been proud of their unyielding commitment to provide objective and unbiased information, to enable their users to take better and more confident decisions.