- GBP/USD has had a calm session trading only 0.05% lower.
- There is a flag pattern on the 4-hour chart that is still in play.
Fundamental Backdrop
Today we got the latest CPI reading from the UK and there was no real cause for concern. The year on year figure came in at 1.5% vs expectations of 1.6% and the Bank of England have the same 2% target as most of the worlds central banks. The key reason for the miss was the GBP strength seen in recent weeks. Markets have started pricing in Boris Johnson’s deal after it was agreed with Mr Barnier from the EU. Now we have the prospect of a general election in our hands and all data pales in comparison to that on December 12th.
Tomorrow we get the latest retail sales data. Although it is important it may not move the market unless it is really out of line.
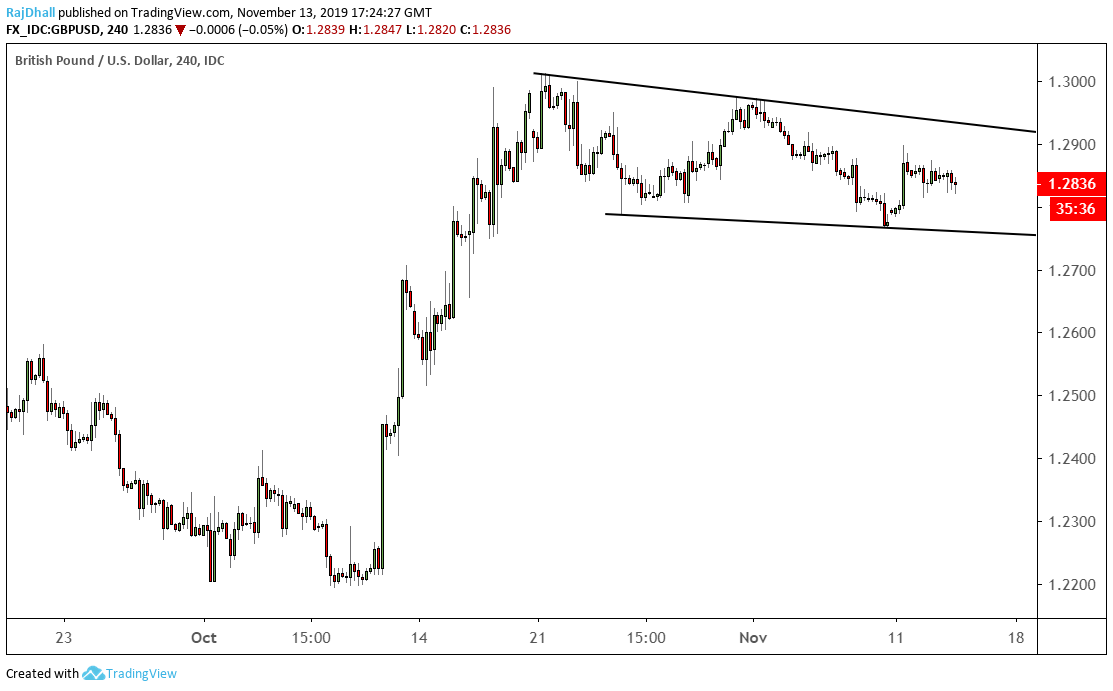
4-Hour Chart
The flag pattern can be seen on the 4-hour and daily chart. It is now a consolidation pattern while we are in an inflexion point waiting for the outcome of the General Election.
The pattern low of 1.2768 needs to be watched as it is now an important support.
On the topside 1.3000 is the key breakout figure as price failed there quite recently.
Other than that maybe data from the polls or political twists and turns can move us away from the flag pattern but overall it should stay in place.