Home GBP/USD Technical Analysis: descending channel breakout confirms a bullish bias
FXStreet News

GBP/USD Technical Analysis: descending channel breakout confirms a bullish bias

   “¢   Break above 100-hour SMA supportive of the up-move for the second straight session.
   “¢   Move beyond 200-hour SMA now a key to confirm a near-term bullish breakout.  
   “¢   Hourly RSI gradually heading towards oversold territory and might cap additional gains.
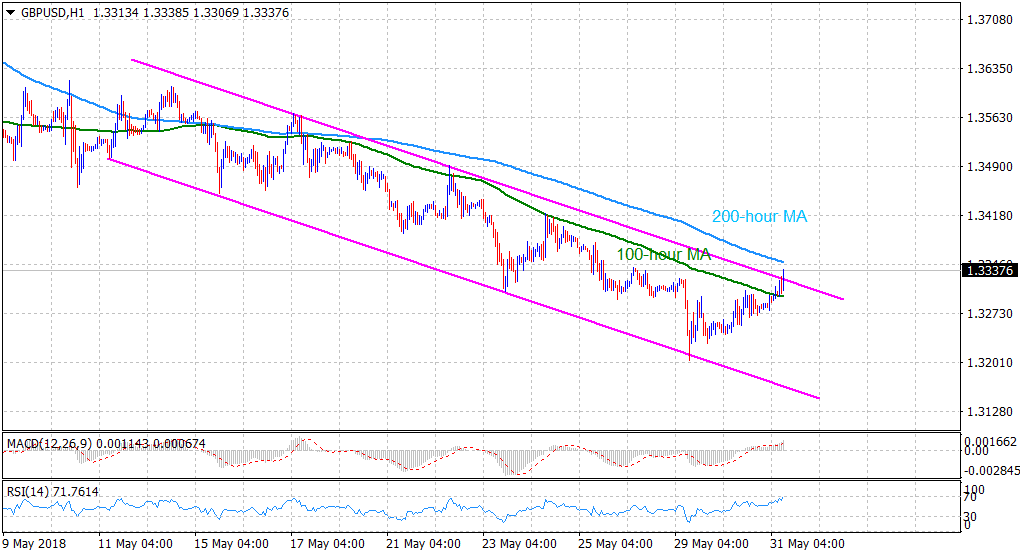
GBP/USD 1-hourly chart

Spot rate:         1.3338
Trend:               Turning bullish  

Support 1:         1.3298 (100-hour SMA)
Support 2:         1.3277 (daily low)
Support 3:         1.3204 (May 29th low)

Resistance 1:    1.3349 (200-hour SMA)
Resistance 2:    1.3385 (R3 daily pivot point)
Resistance 3:    1.3422 (May 24th swing high)

FX Street

FX Street

FXStreet is the leading independent portal dedicated to the Foreign Exchange (Forex) market. It was launched in 2000 and the portal has always been proud of their unyielding commitment to provide objective and unbiased information, to enable their users to take better and more confident decisions.