- The hourly chart shows the GBP/USD pair has created a pennant pattern – a bearish continuation pattern, meaning a downside break would open the doors to 1.30 (psychological level).
- An upside break would abort the immediate bearish outlook.
Hourly chart
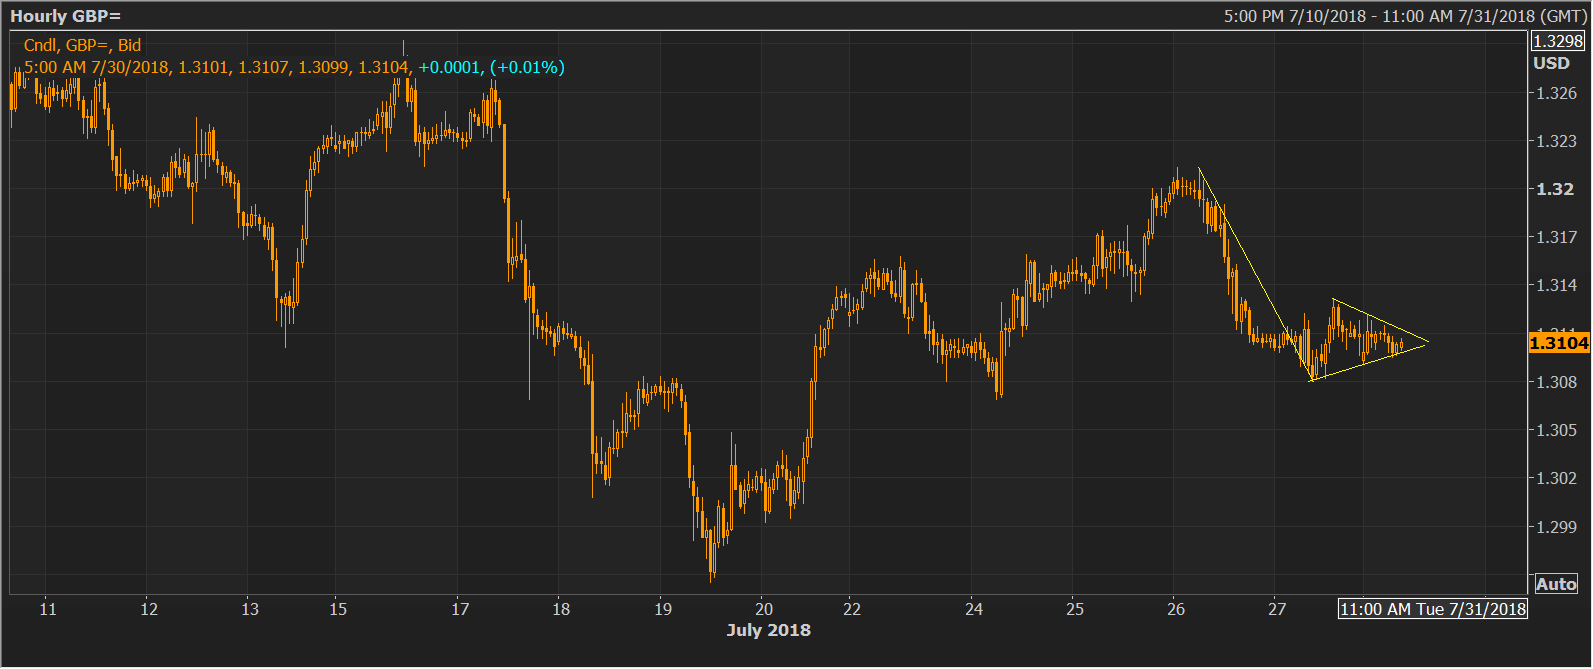
Spot Rate: 1.3104
Daily High: 1.3116
Daily Low: 1.3097
Trend: Bearish after downside break pennant pattern
R1: 1.3130 (5-day moving average)
R2: 1.3213 (Thursday’s high)
R3: 1.3241 (50-day moving average)
Support
S1: 1.3082 (Friday’s doji candle low)
S2: 1.3049 (June 28 low)
S3: 1.2957 (July 19 low)
