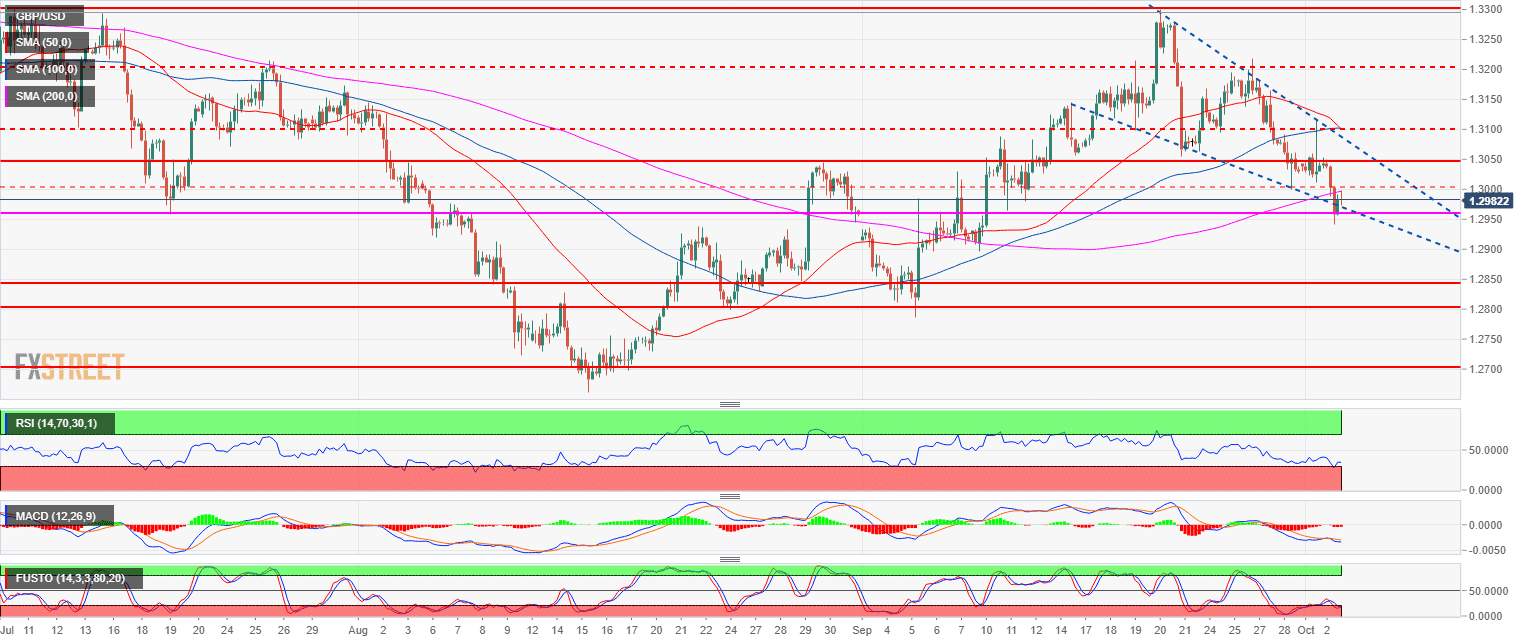
- GBP/USD is consolidating the gains of the last weeks in a bull flag above 1.2957 level which has been a key level in the last months of trading.
- GBP/USD broke below its 200-period simple moving average and below the bear trendline (blue) while the MACD and Stochastics are displaying divergence with the current price. GBP/USD is equally finding support above the key 1.2957 level (July 19 swing low).
- Bulls objective is to reclaim 1.3000 to target 1.3200 figure. A bear breakout below 1.2957 would be seen as bearish and invalidate the bullish reversal.
Spot rate: 1.2980
Relative change: 0.45%
High: 1.3052
Low: 1.2941
Main trend: Bullish
Short-term trend: Neutral
Resistance 1: 1.3000 figure
Resistance 2: 1.3050 August 30 swing high, key level
Resistance 3: 1.3100 figure
Resistance 4: 1.3144 key level
Resistance 5: 1.3200 figure (key support/resistance)
Resistance 6: 1.3300 figure
Resistance 7: 1.3363 July high
Resistance 8: 1.3472 June 7 high
Support 1: 1.2957 July 19 swing low
Support 2: 1.2900 figure
Support 3: 1.2800 figure
