- GBP/USD is having a pullback after trading near the daily highs as it found resistance a few pips below the 1.3155 resistance level.
- Nothing indicates that the bullish pressure should abate. The 50 and 100-period simple moving averages (SMA) crossed above the 200 SMA confirming the current bullish bias.
- The key resistance to the upside is the 1.3155 level followed by the 1.3200 figure while support is likely located near 1.3100-1.3076 area.
GBP/USD 15-minute chart
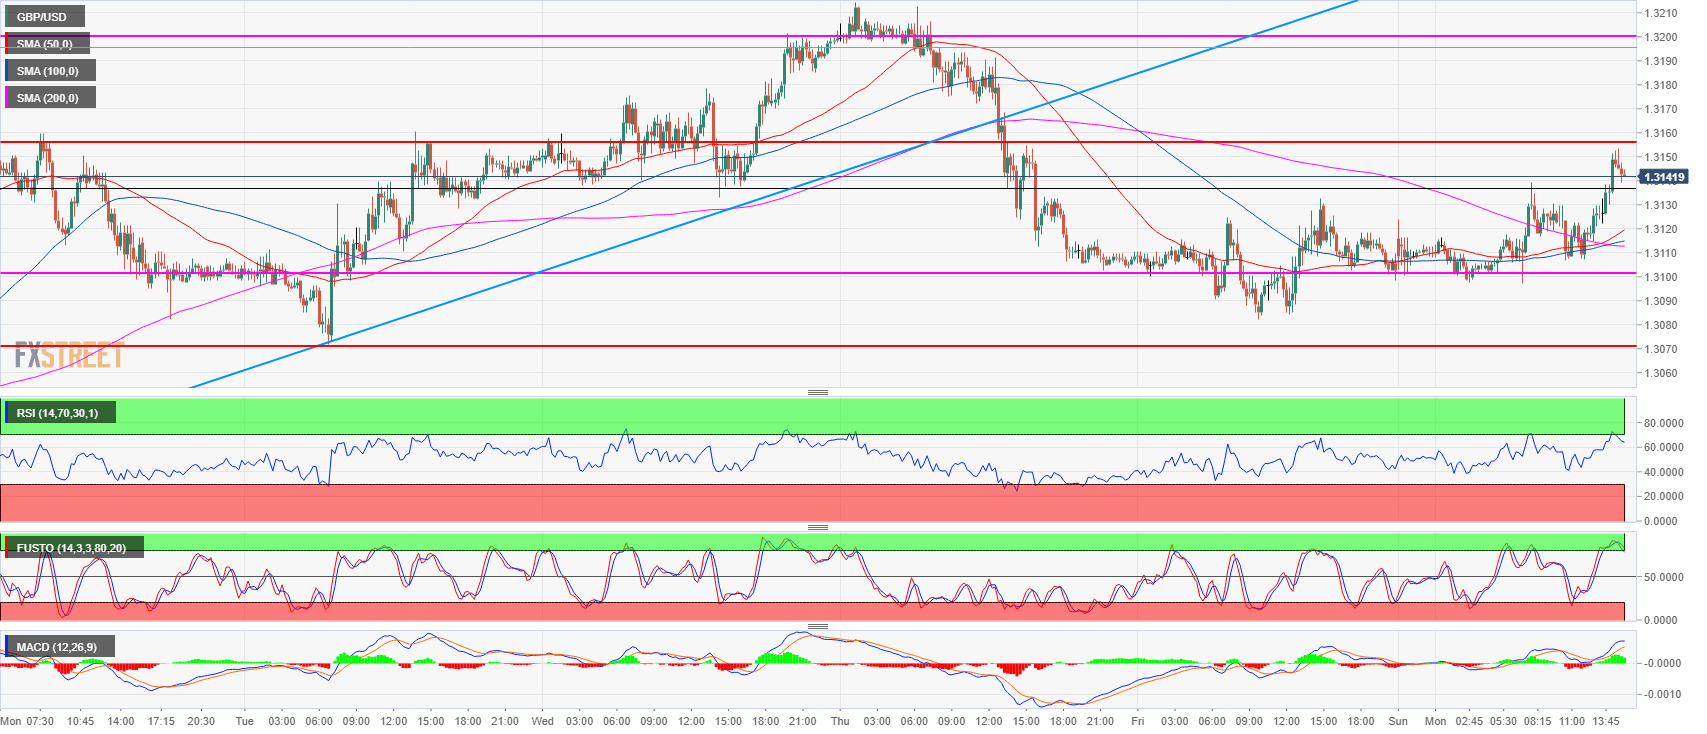
Spot rate: 1.3141
Relative change: 0.3%
High: 1.3153
Low: 1.3097
Trend: Bearish / Bullish correction
Resistance 1: 1.3155 former breakout point
Resistance 2: 1.3200 figure
Resistance 3: 1.3230 supply level
Resistance 4: 1.3250 June 4 high
Support 1: 1.3100-1.3076 area, figure and weekly low
Support 2: 1.3049 June 28 low
Support 3: 1.3010 July 18 low
Support 4: 1.2957 current 2018 low
Support 5: 1.2908 September 5, 2017 low
