GBP/USD jumped to 1.3149 in Asia – the highest level since Jan. 31 – bolstering the bullish setup seen on the 4-hour chart. As a result, the pair could rise further toward 1.3180-1.32 in the next 24 hours.
4-hour chart
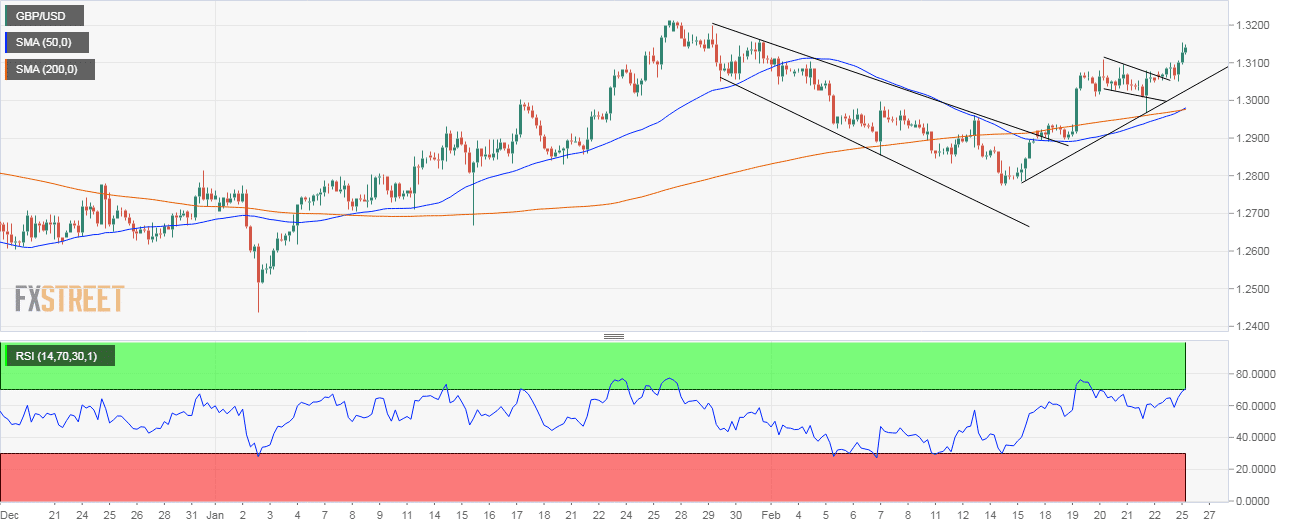
- The path of least resistance is to the higher side, as indicated by the falling channel breakout and flag breakout seen in the above chart.
- Supporting that bullish case are the ascending 5- and 10-week moving averages (MAs) and an above 50-reading on the relative strength index.
- The 50-candle MA has also moved back above the 200-candle MA, confirming a bullish move.
Trend: Bullish
