- Back-to-back Doji candles on GBP/USD’s daily chart indicate indecision.
- A bullish Doji reversal needs a daily close above 1.2339.
The GBP/USD pair defended the widely followed 50-day moving average on Tuesday and Wednesday with Doji candles.
A Doji represents indecision in the market place. In GBP/USD’s case, the Doji candles have appeared following a sell-off from recent highs near 1.2580 and at the 50-day MA support and represent seller exhaustion.
That said, a bullish Doji reversal would be confirmed if the pair finds acceptance above 1.2339 – the high of Oct. 1’s Doji candle.
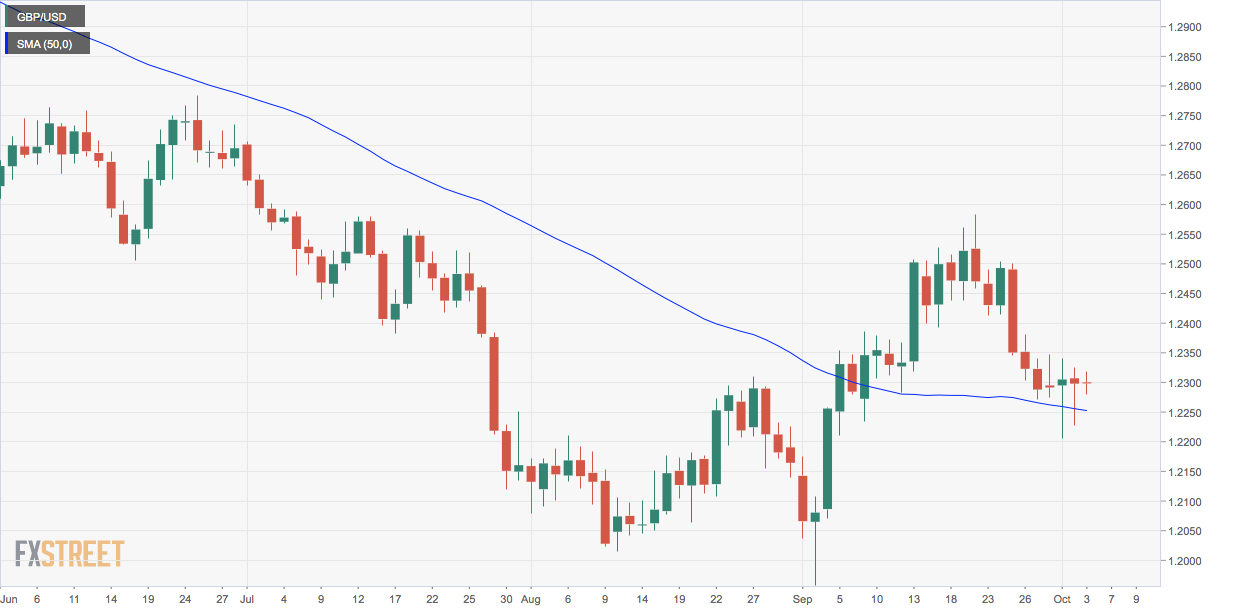
On the downside, a close below the 50-day MA, currently at 1.2249, would imply a continuation of the sell-off from the recent high of 1.2582 and open the doors for 1.21.
As of writing, the pair is trading just below 1.23, representing little change on the day.
Daily chart
Trend: Neutral
Technical levels
