- Rising RSI, MACD, far from overbought conditions, favor further upside of the GBP/USD pair.
- 4H 50MA, 8-week old descending trend-line gain bull’s attention.
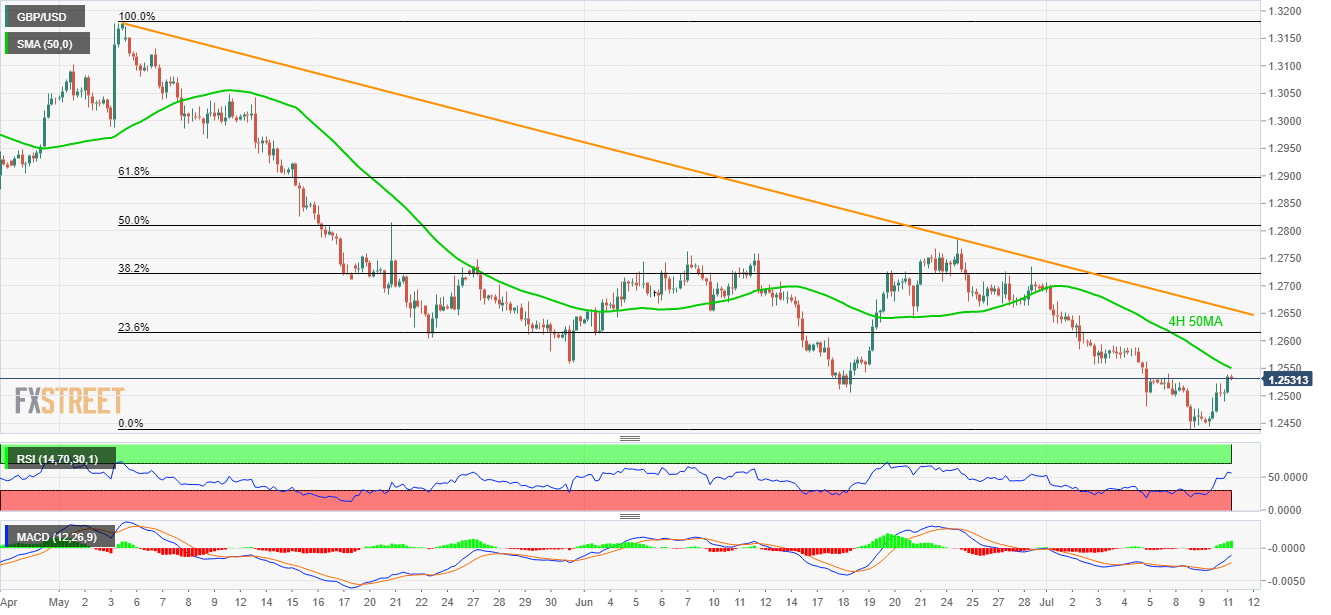
Following its pullback from the year’s low surrounding 1.2430, the GBP/USD pair is trading around 1.2531 heading into the UK open on Thursday.
Momentum indicators like 14-bar relative strength index (RSI) and 12-bar moving average convergence and divergence (MACD) are both supporting the price recovery and are far from overbought conditions.
With this, buyers can aim for 50-bar moving average on the 4-hour chart (4H 50MA) at 1.2550 ahead of targeting early-month low near 1.2560.
During the pair’s further advances, 23.6% Fibonacci retracement of May-July downside, at 1.2615, close to the 2-month old resistance-line level at 1.2658/60, can challenge the bulls.
On the contrary, price declines below 1.2430 might not hesitate pleasing bears with 1.2400 round-figure whereas April 2017 lows surrounding 1.2370 may gain their attention afterward.
GBP/USD 4-hour chart
Trend: Pullback expected
