- GBP/USD is moving towards a breakout point within a rising wedge on the daily chart.
- As can be seen in the chart below, 1.3290s is a key level and will determine whether the pair breaks out to the top side or fall out of the wedge to the downside on sustained pressures below it.
- However, the price still has some work to do until it reaches the narrowest point of the wedge and a breakout would be expected to take place within the eclipse if the price supported at 1.3040/50 initially.
- The price is currently heading back south and trades below the 1.3290 horizontal line with daily stochastics leaning bearish, supporting the correction to the downside within the wedge.
- A break to the downside and below 1.3040 support would be expected to make way for a continuation of the mid-April commencing bear trend towards the flash crash lows in the 1.2350s and beyond.
- However, GBP is trading erratically due to Brexit headlines which likely jeopardises the traditional technical chart patterns. A breakout is expected one way or another depending on the outcome of the fundamentals. In such a scenario, the flash crash lows and late 1.40 the figure guarding mid-April highs in the 1.4380s would be targetted.
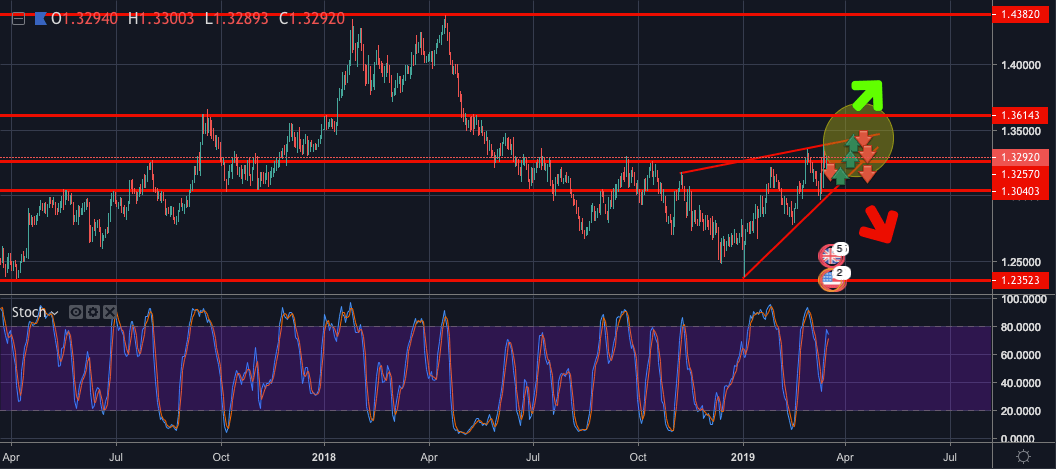
GBP/USD daily chart
