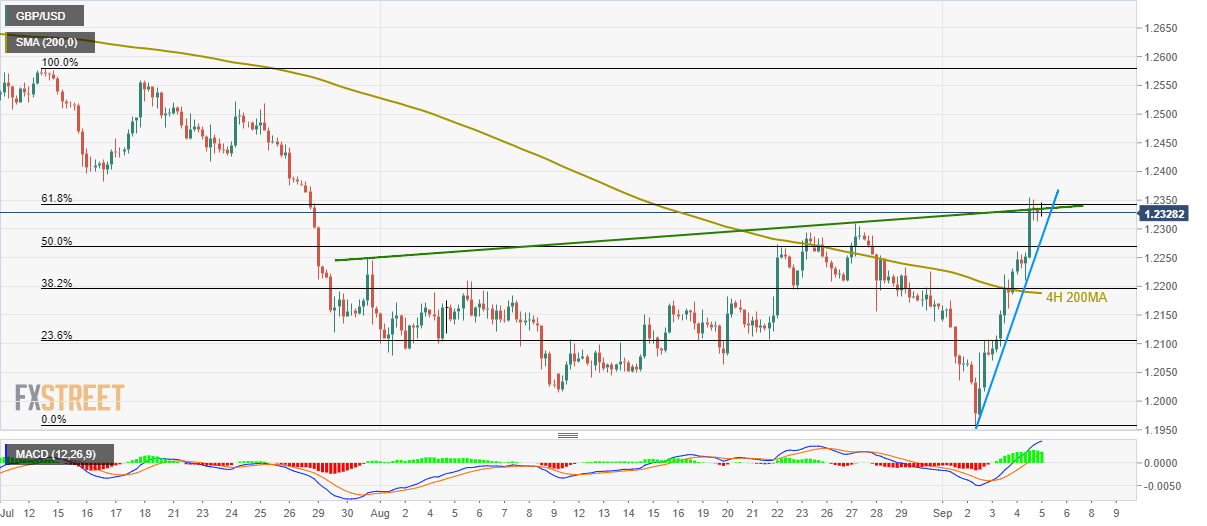
- GBP/USD repeatedly fails to clear 61.8% Fibonacci retracement, five-week-old resistance-line.
- Sellers await a downside break of three-day-long rising trend-line to aim for 4H 200MA.
GBP/USD buyers seem to lose the upside momentum as the quote struggles to clear near-term key resistance area while making the rounds to 1.2330 by the press time of early Asian session on Friday.
61.8% Fibonacci retracement of July-September downpour and a rising trend-line since July 31 act as immediate upside barriers for the pair’s recovery to more than a month high.
However, prices are still trading beyond a three-day-old rising trend-line and hence sellers await a break of 1.2285 In order to target 50% Fibonacci retracement level of 1.2270 and 200-bar moving average on the four-hour chart (4H 200MA) near 1.2190.
It should be noted that pair’s declines below 1.2190 might take a halt around 1.2100 round-figure before revisiting August 11 lows surrounding 1.2015 and 1.2000 mark.
Meanwhile, an upside clearance of 1.2335/43 area including aforementioned resistance-line and 61.8% Fibonacci retracement, opens the door for the pair’s further rise towards 1.2385 and July 23 low close to 1.2420.
GBP/USD 4-hour chart
Trend: pullback expected
