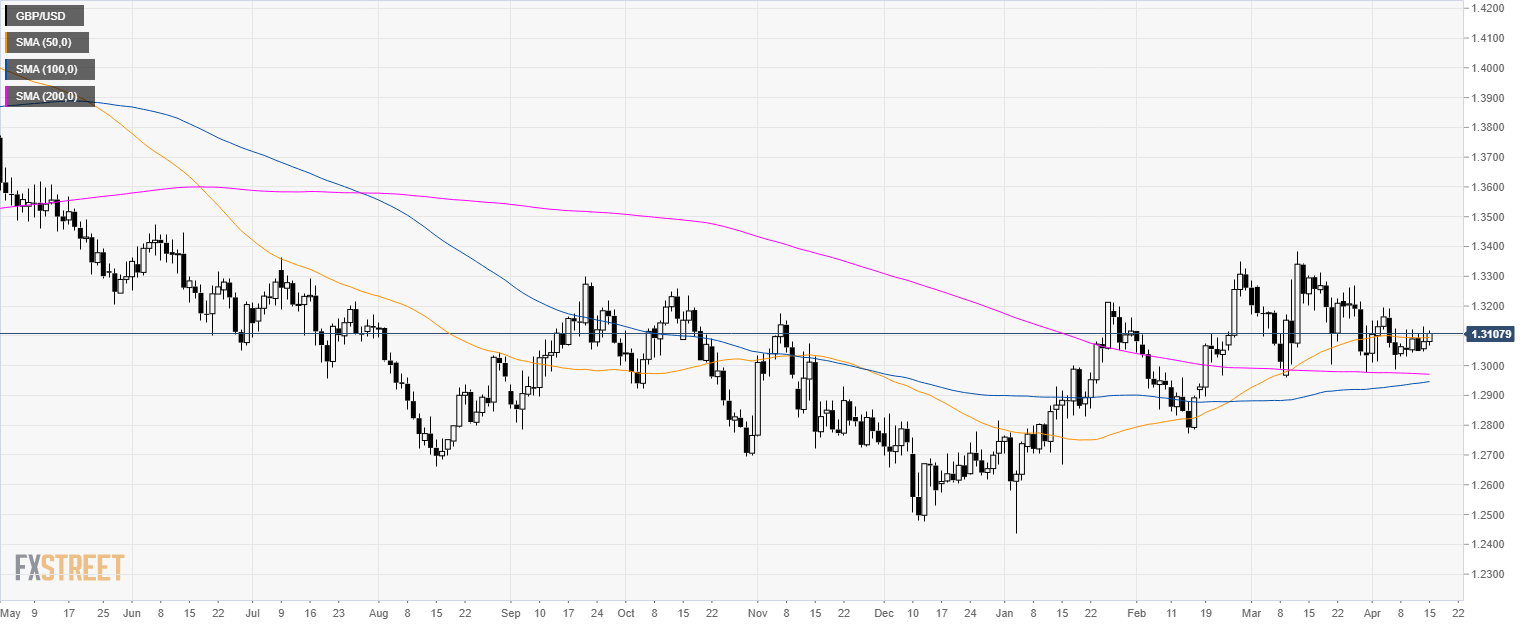
GBP/USD daily chart
- GBP/USD is consolidating above the 200-day simple moving average (SMA).
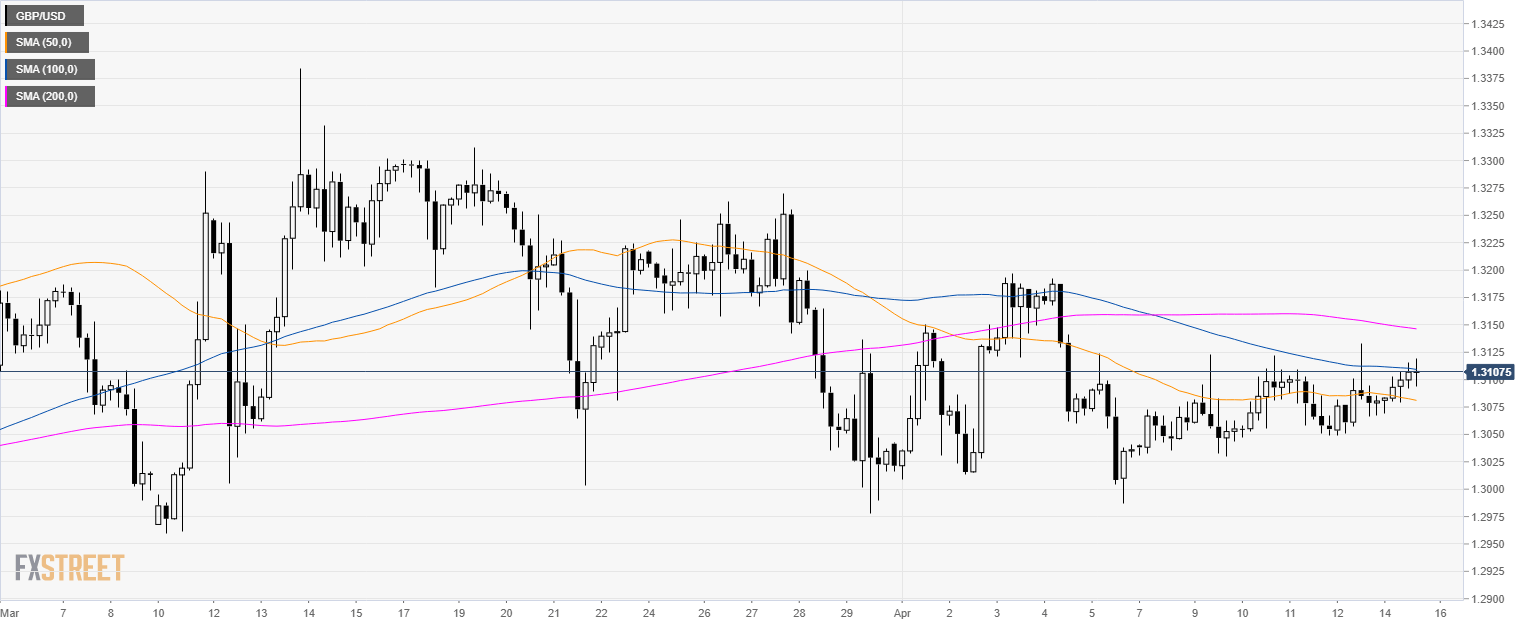
GBP/USD 4-hour chart
- GBP/USD is stuck between the 50 and 100 SMA.
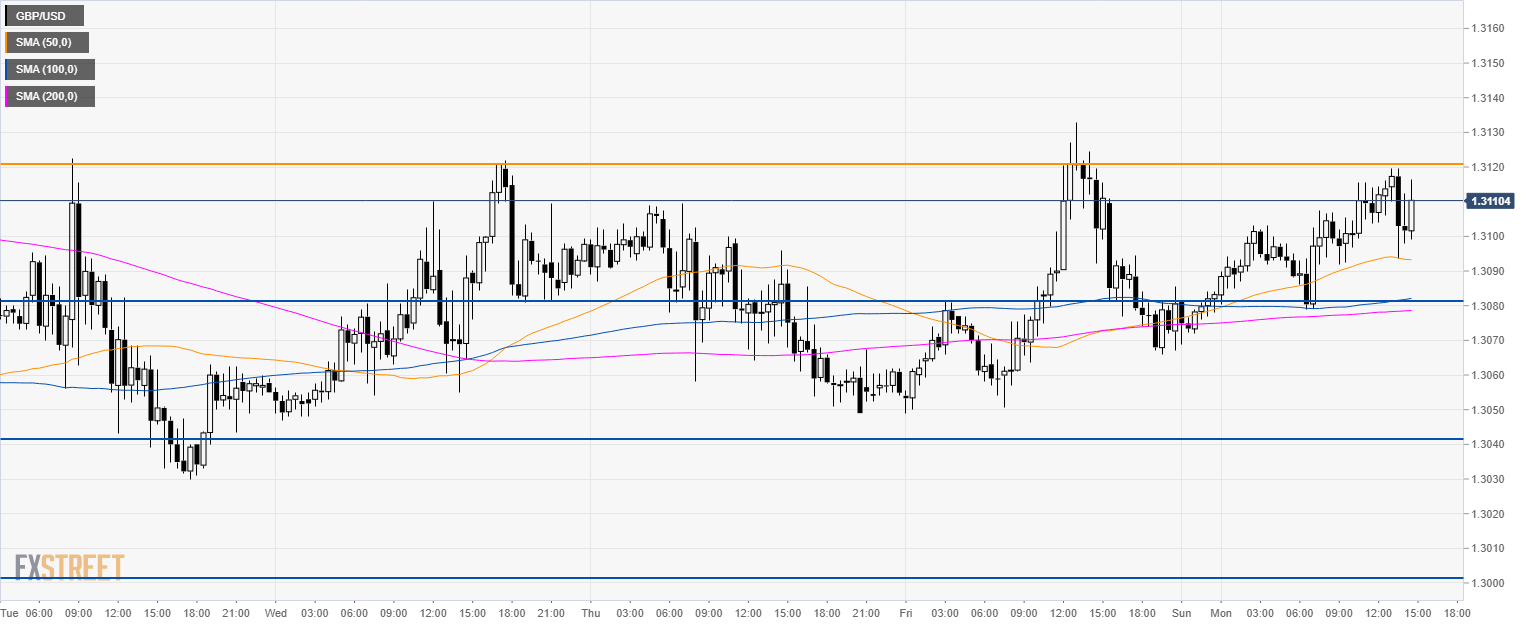
GBP/USD 30-minute chart
- GBP/USD remains directionless below 1.3120 key resistance.
- Bulls have a small advantage but unless 1.3120 resistance is broken Cable remains stuck in its range.
- Support is at 1.3080 and 1.3040 level to the downside while a break above 1.3120 resistance should open the doors to the 1.3200 figure.
Additional key levels
