- GBP/USD extends pullback from a downward sloping trend-line since July 31.
- The confluence of 100-HMA, 23.6% Fibonacci retracement becomes immediate support.
- Four-day old support-line adds to the rest-points.
Having reversed from a fortnight old resistance-line, GBP/USD takes the rounds to 1.2085 during early Friday morning in Asia.
The pair can now aim for 1.2071/70 support confluence including 100-hour moving average (HMA) and 23.6% Fibonacci retracement of July 31 to August 11 downpour, a break of which can further drag the quote to four-day long support-line at 1.2058 now.
Should there be increased selling pressure after 1.2058, 1.2040 and the latest low surrounding 1.2015 could be on the bears’ radar.
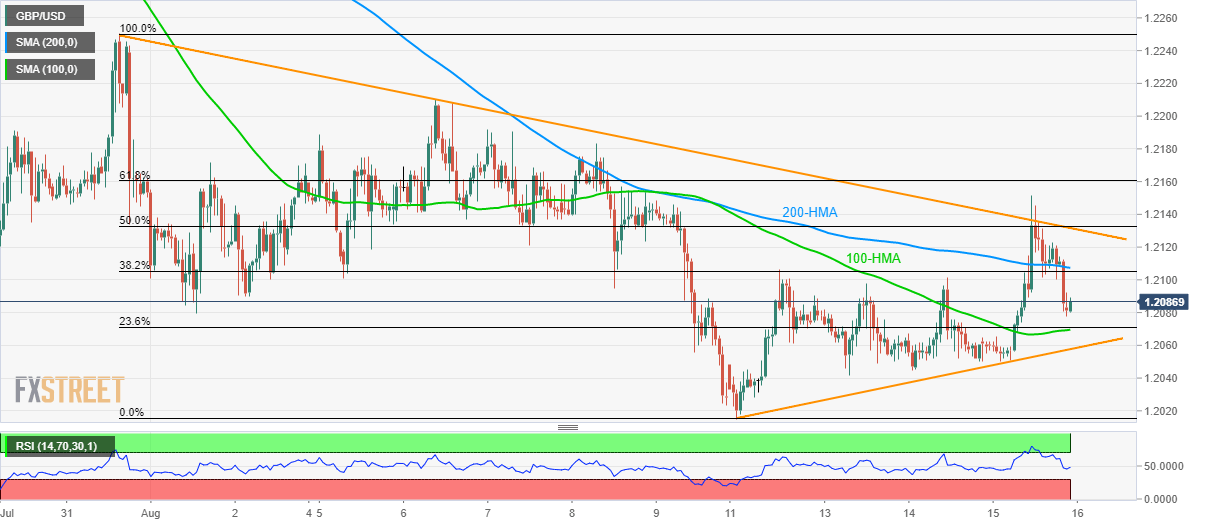
On the upside, 38.2% Fibonacci retracement level of 1.2105 and 200-HMA around 1.2107 can entertain buyers ahead of pushing them to again confront near-term key resistance-line and 50% Fibonacci retracement confluence close to 1.2132/33.
If prices rally past-1.2133, 1.2160 and 1.2210 are likely following numbers to appear on the chart.
GBP/USD hourly chart
Trend: Sideways
