- GBP/USD remains on the back foot below 100-HMA.
- 200-HMA can entertain sellers before 61.8% Fibonacci retracement, eight-day-old support-line come into play.
With its sustained trading below 100-hour moving average (HMA), GBP/USD drops to 1.2122 ahead of the UK market open on Thursday.
As a result, odds are high for the pair’s drop to 200-HMA support of 1.2104. However, 1.2078/77 confluence including 61.8% Fibonacci retracement of last two weeks’ run-up and an upward sloping trend-line since August 11 will challenge bears afterward.
In a case where prices plummet below 1.2077, 1.2050/45 and 1.2015 will again appear on the chart.
On the flip side, 1.2136/37 including 100-HMA and immediate declining trend-line exert downside pressure on the pair, a break of which could quickly propel the quote to week’s high around 1.2183.
GBP/USD hourly chart
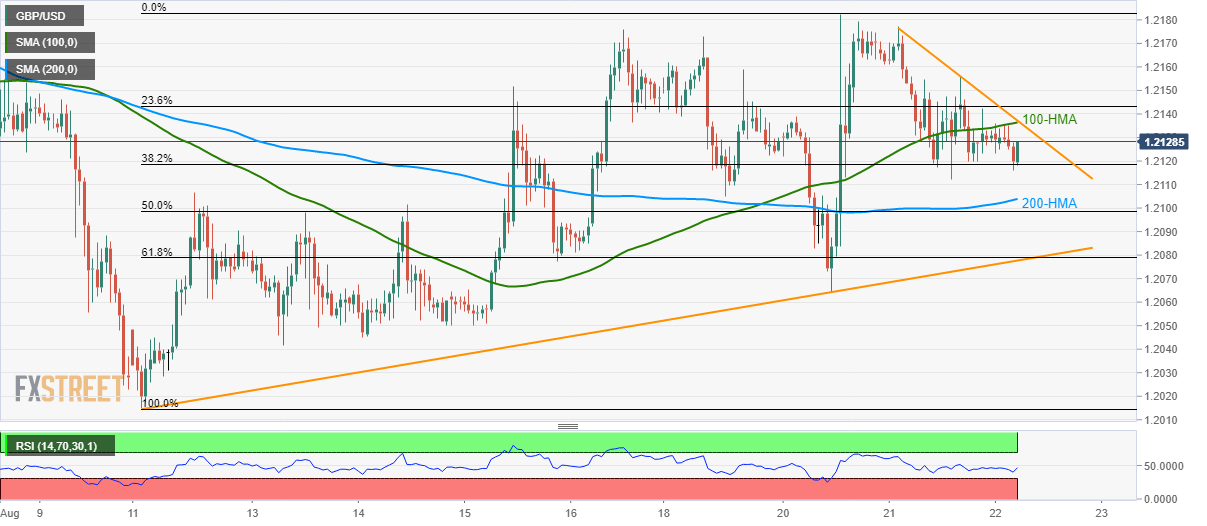
Trend: Pullback expected
