- The Sterling remains trapped under Brexit headlines, and intraday action is turning increasingly bearish, with the GBP/USD off of recent highs.
- Hourly EMAs see the pair set for continued downside, with Daily Stochastics and RSI heading south from their respective midpoints.
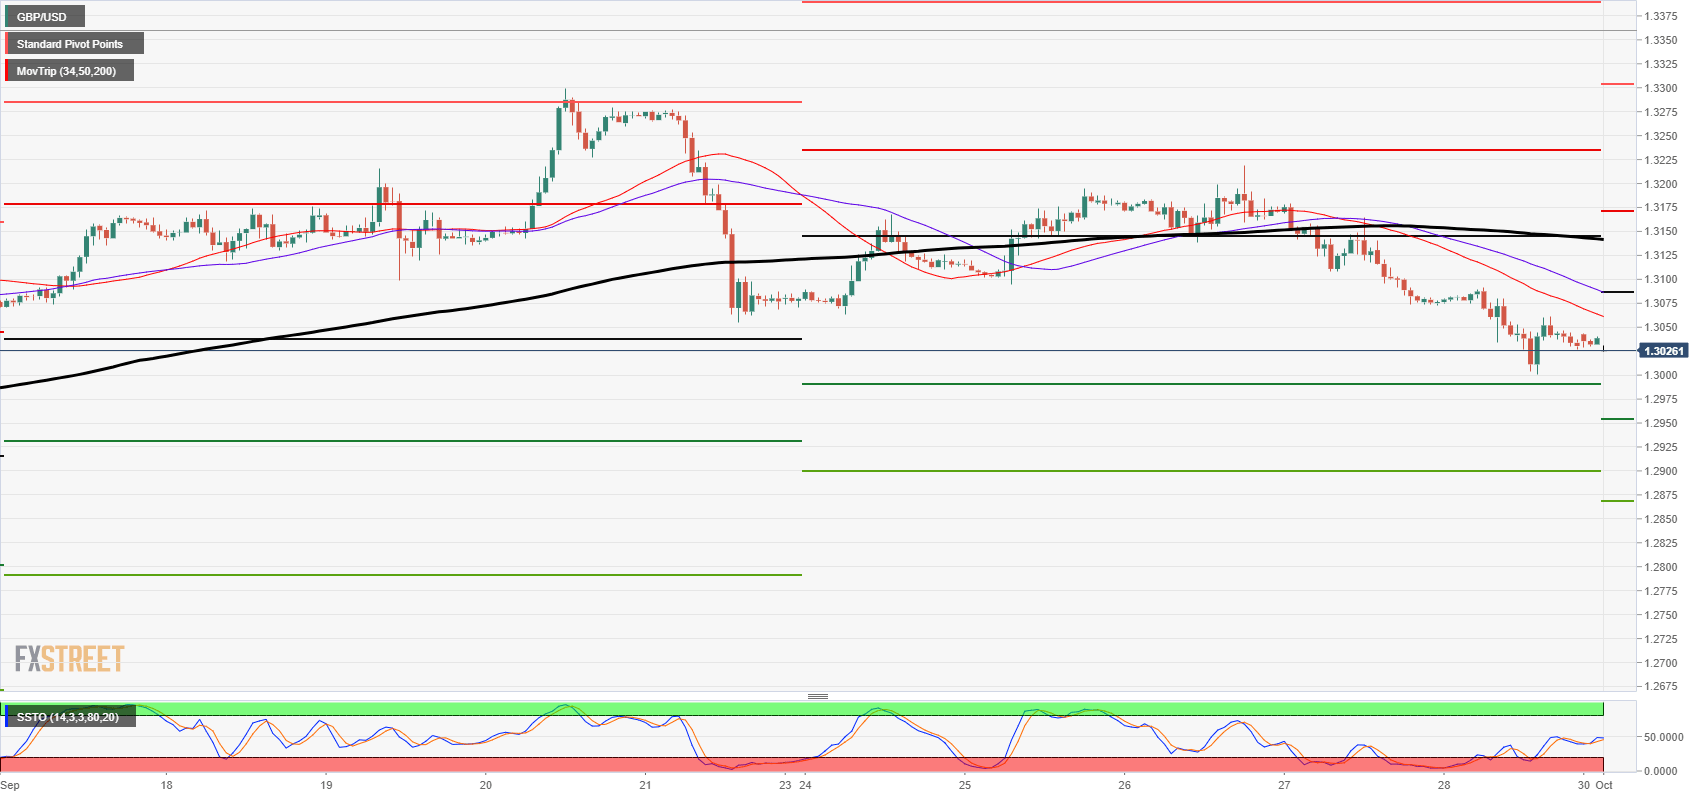
| Spot rate | 1.3026 |
| Previous week change | -0.28% |
| Previous week high | 1.3217 |
| Previous week low | 1.3000 |
| Support 1 | 1.3000 (major technical level) |
| Support 2 | 1.2975 (200-period 4-hour EMA) |
| Support 3 | 1.2867 (S3 weekly pivot) |
| Resistance 1 | 1.3138 (200-hour EMA) |
| Resistance 2 | 1.3298 (September peak; two-month high) |
| Resistance 3 | 1.3510 (200-day EMA) |
