- GBP/USD stays on the back foot below 21-DMA.
- Bearish MACD favor declines to the confluence of 50-DMA, 38.2% Fibonacci retracement.
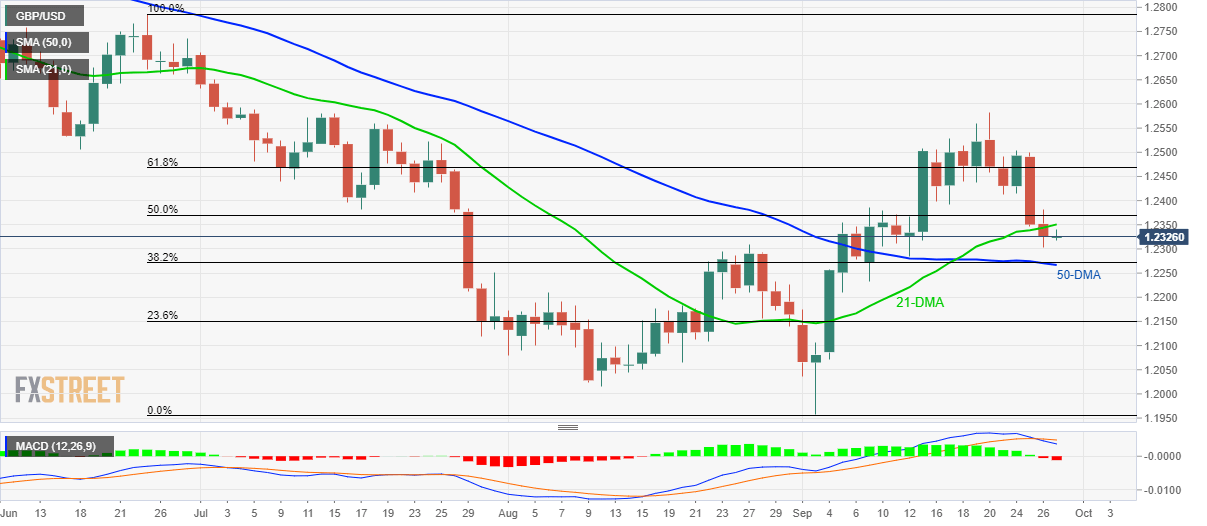
Sustained trading below 21-day simple moving average (DMA), coupled with the bearish signal from the 12-bar moving average convergence and divergence (MACD) indicator, portrays the GBP/USD pair’s weakness as it trades near 1.2325 during Friday’s Asian session.
With this, sellers can take aim at 1.2272/66 support-confluence including 50-DMA and 38.2% Fibonacci retracement of June-September downpour.
In a case prices decline below 1.2266, 1.2200 and 23.6% Fibonacci retracement level of 1.2150 could please the bears.
On the contrary, daily closing above 21-DMA level of 1.2350 could trigger fresh pullback towards 1.2415 and 61.8% Fibonacci retracement near 1.2470.
Though, additional rise above 1.2470 could push bulls to challenge monthly top close to 1.2580.
GBP/USD daily chart
Trend: bearish
