- GBP/USD pulls back from neck-line of short-term inverse head-and-shoulders.
- Sustained trading below 61.8% Fibonacci retracement highlights a week-long support-line.
- Overbought RSI conditions increase the odds of a profit-booking wave.
Having failed to cross a fortnight old rising trend-line, GBP/USD declines to 1.2345 during Tuesday morning in Asia.
In doing so, the Cable refrain from confirming a short-term inverse head-and-shoulders bullish formation, which in-turn portrays brighter chances of the quote’s pullback should it manage to break 1.2340 immediate support including 61.8% Fibonacci retracement of July-September declines.
Also supporting the correction to 1.2270/68 confluence, comprising one-week-old rising trend-line and 50% Fibonacci retracement, is overbought conditions of 14-bar relative strength index (RSI).
Should prices slip below 1.2268, a sub-1.2200 area will well flash on sellers’ radar.
On the upside, pair’s sustained run-up beyond 1.2375 resistance-line could trigger fresh advances to 1.2430 and 1.2500 with late-July tops surrounding 1.2520 and 1.2560 likely being next on bulls’ radar.
GBP/USD 4-hour chart
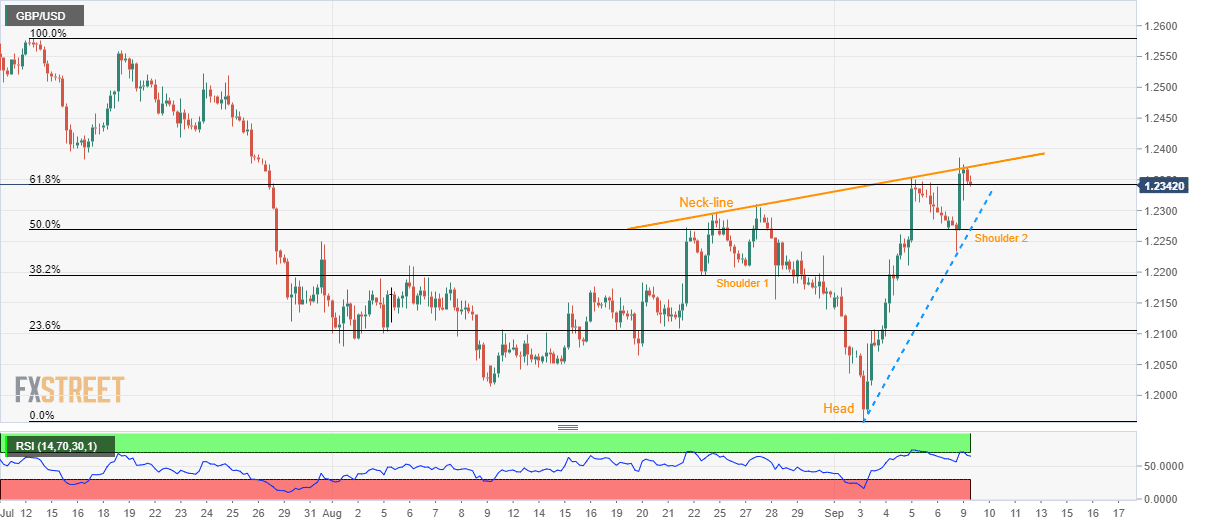
Trend: pullback expected
