- As the Brexit gets delayed, GBP/USD is retracing down below the 1.2900 handle.
- The level to beat for bears is the 1.2881 support.
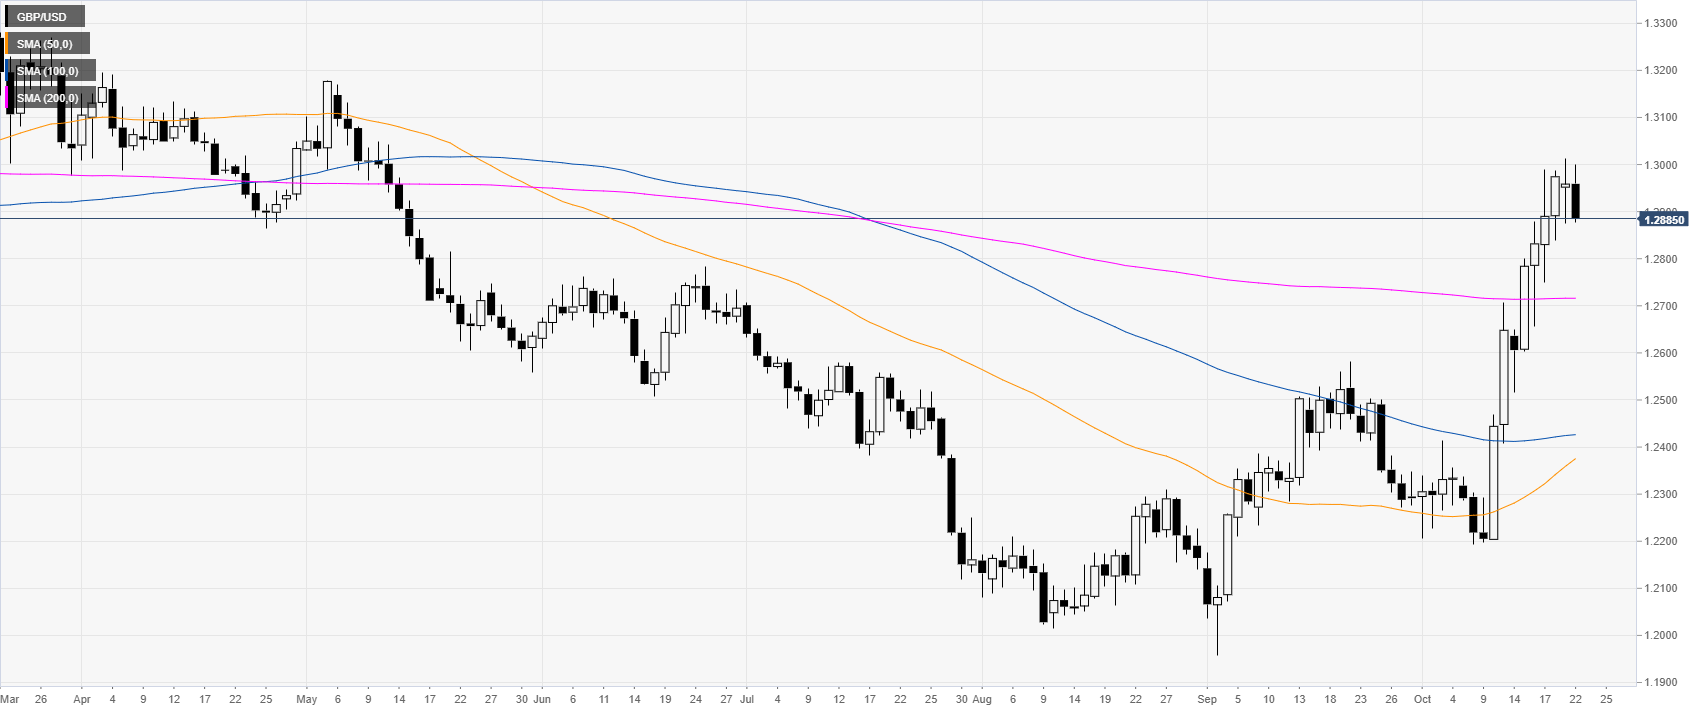
GBP/USD daily chart
The Sterling, on the daily chart, had a spike above the main daily simple moving averages (DSMAs) while reaching levels not seen since mid-May 2019. UK PM’s Johnson loses the second vote, GBP/USD crashes, Brexit likely delayed.
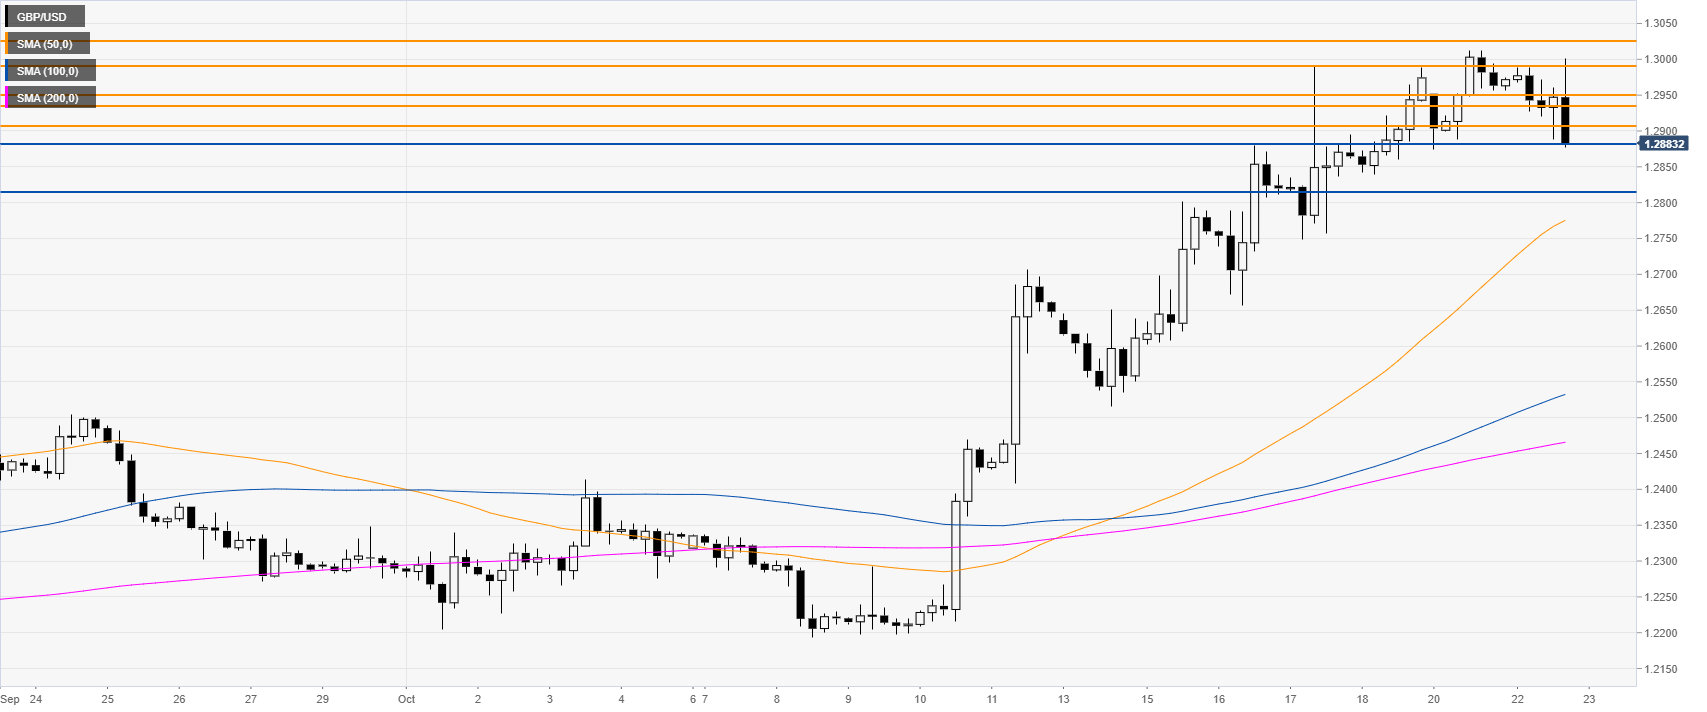
GBP/USD four-hour chart
The Cable is trading in a bull channel above the main SMAs. However, the market is pulling back down sharply, testing the 1.2881 support level. A break below the level can lead to further losses towards the 1.2813 price level, according to the Technical Confluences Indicator.
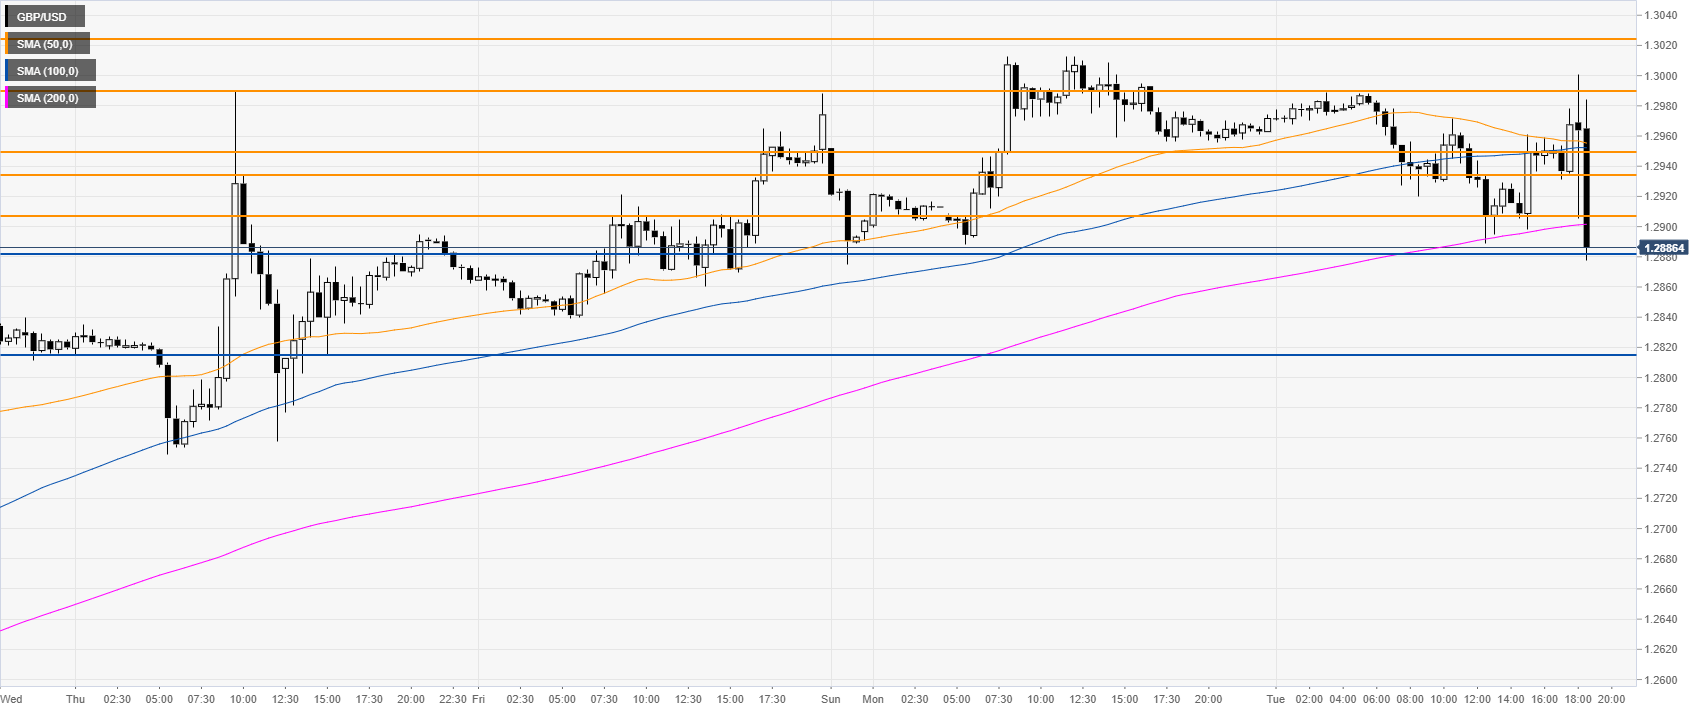
GBP/USD 30-minute chart
GBP/USD is trading below its main SMAs, suggesting potential bearish momentum in the near term. Potential pullbacks could find resistance near 1.2907, 1.2935 and 1.2950, according to the Technical Confluences Indicator.
Additional key levels
