- The Sterling is consolidating the gains made earlier in London.
- Upbeat UK manufacturing and industrial data, as well as Brexit optimism are behind the Pound boost.
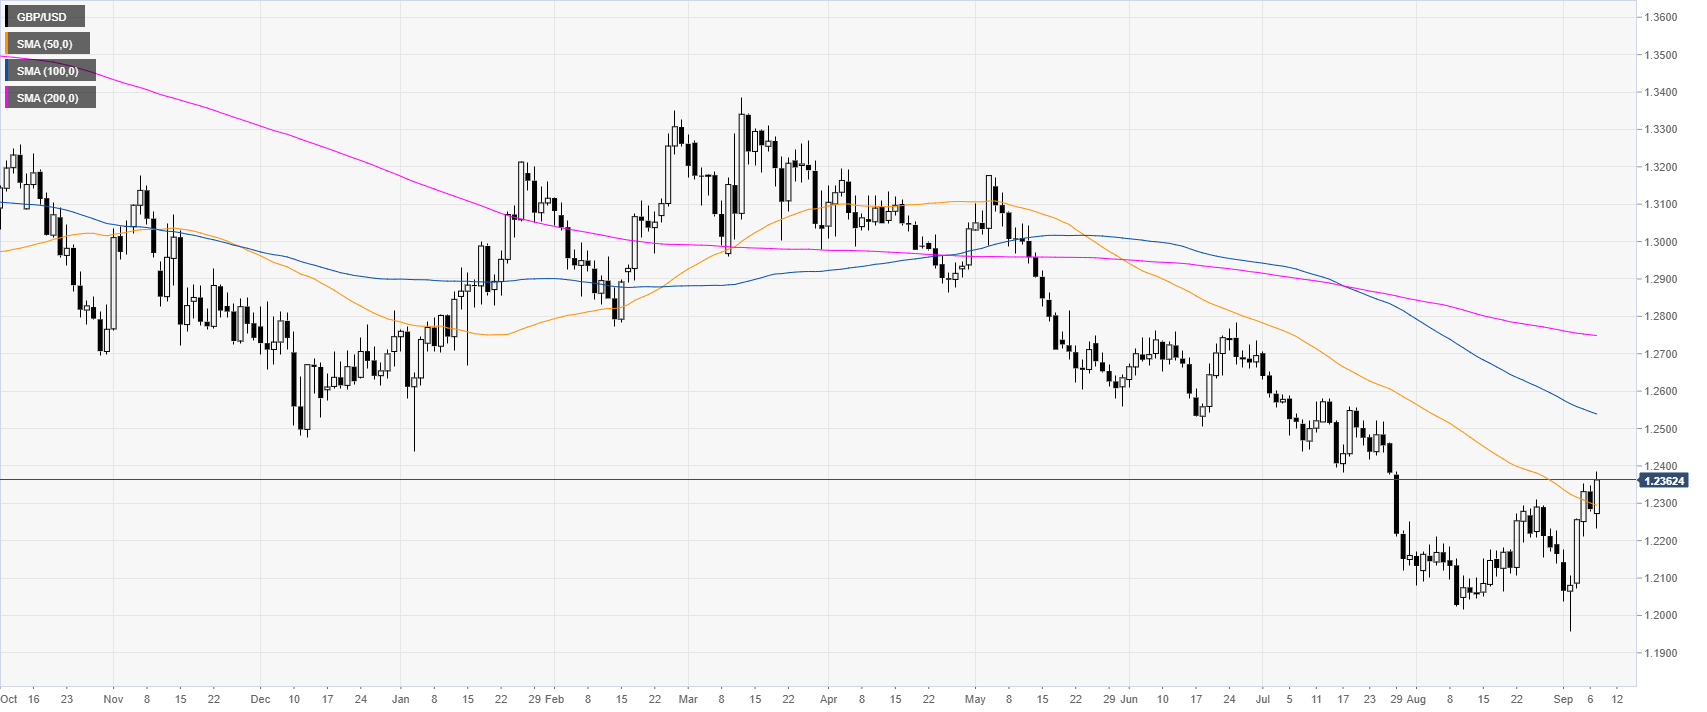
GBP/USD daily chart
The Sterling is trading in a bear trend below the 100 and 200-day simple moving averages (SMAs). The market is trying to establish a double bottom as the market is trading above the 1.2300 figure and the 50 SMA. Earlier in the London session, the Pound got a boost on better-than-expected UK manufacturing and industrial data as well as Brexit optimism.
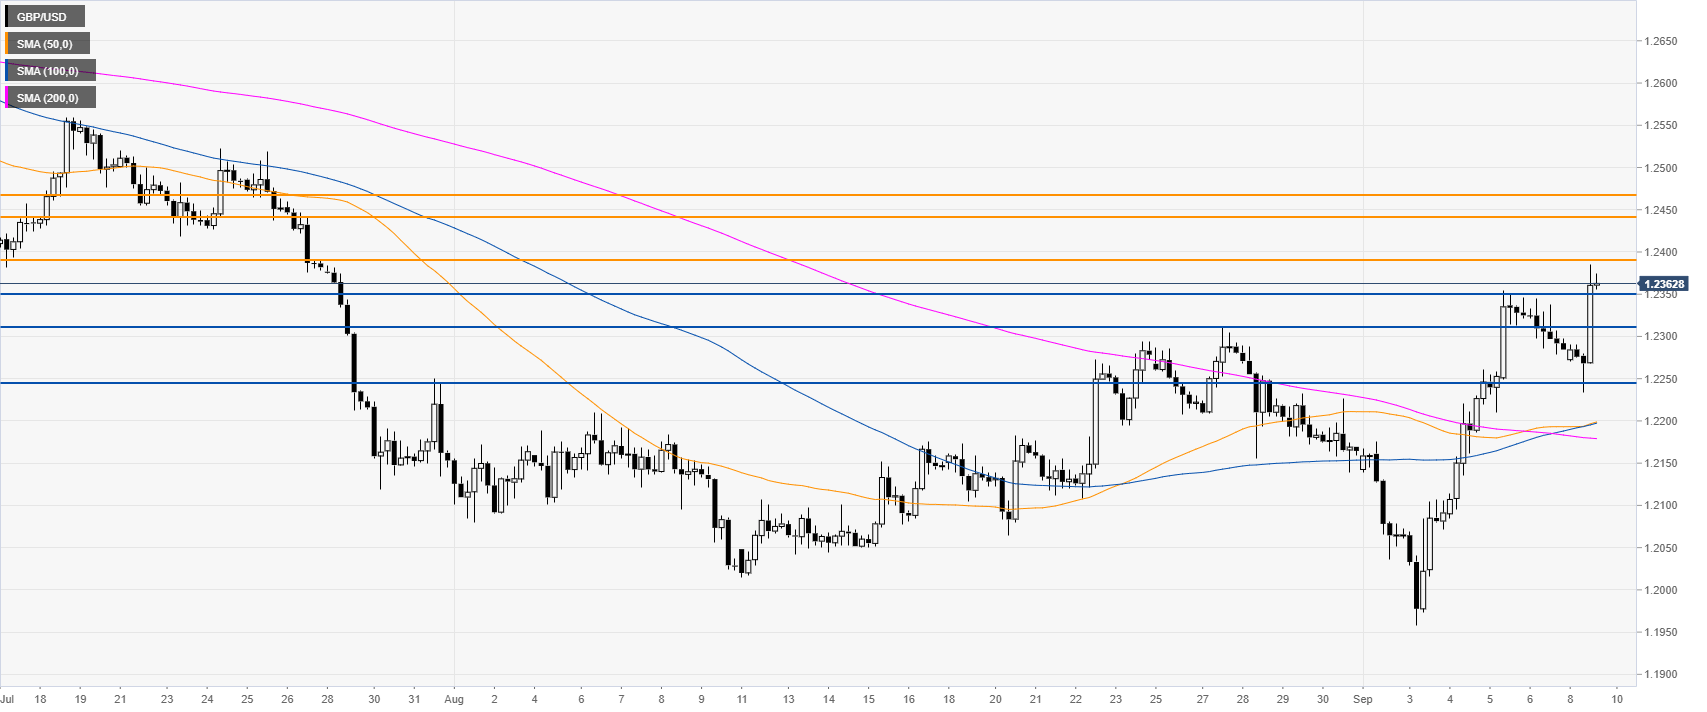
GBP/USD four-hour chart
GBP/USD is challenging last week highs as the market is trading above its main SMAs. Bulls need to break 1.2989 in order to extend the London bullish move. If 1.2989 is broken the next resistances coming into play are seen at the 1.2441 and 1.2467 levels, according to the Technical Confluences Indicator.
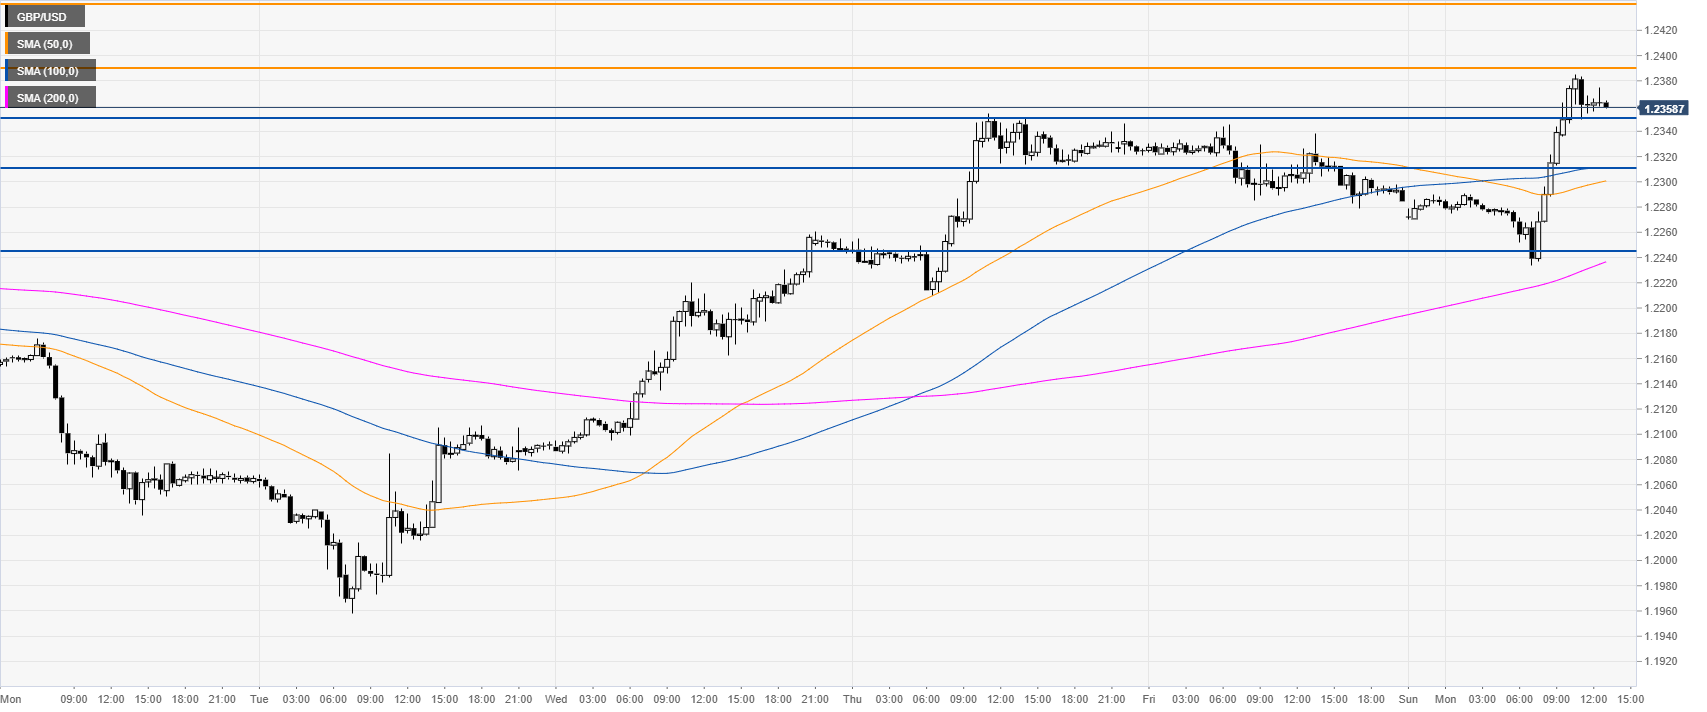
GBP/USD 30-minute chart
GBP/USD is trading above the main SMAs, suggesting bullish momentum in the near term. The market is consolidating the recent intraday gains. Bears need to reclaim the 1.2351 support followed by the 1.2312 and 1.2245 price levels, according to the Technical Confluences Indicator.
Additional key levels
