- GBP/USD created a doji candle on Thursday, signaling bearish exhaustion.
- A falling wedge breakout, however, is needed to confirm bullish reversal.
Signs of seller exhaustion have emerged on GBP/USD’s daily chart. The outlook, however, would turn bullish if and when the pair moves out of the falling wedge – a bullish reversal pattern.
Daily chart
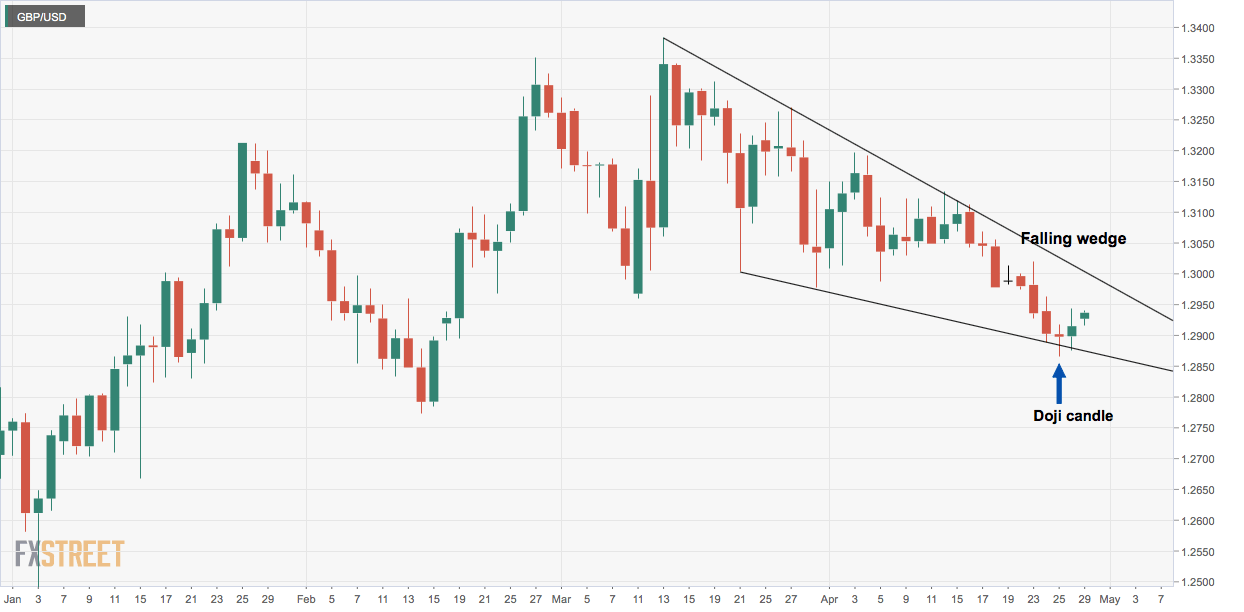
As seen above, the pair created a doji candle on Thursday, which is widely considered a sign of indecision. The candle, however, appeared at the falling wedge support and after a notable price sell-off.
The indecision, therefore, could be predominantly among sellers and the doji candle could be considered a sign of bearish exhaustion.
Even so, the immediate outlook is neutral as the pair is trapped in a falling wedge. As of writing, the wedge resistance is seen at 1.30. A daily close above that level would confirm a bearish-to-bullish trend change.
A bearish view would be revived if the spot finds acceptance below 1.2865 (Doji’s low).
Trend: Neutral
Pivot points
