“¢ The pair faced rejection near the 1.3300 handle at the start of a new trading week and tumbled to fresh session lows, below mid-1.3200s in the last hour.
“¢ The pair’s inability to capitalize on Friday’s goodish up-move and a subsequent sharp retracement slide clearly point to persistent selling bias at higher levels.
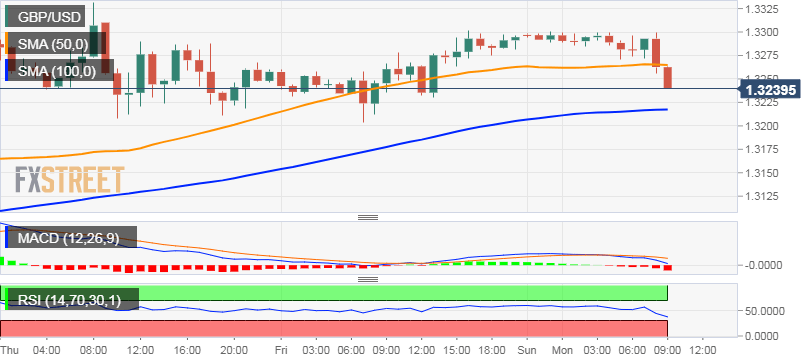
“¢ An intraday dip below 50-hour SMA might be seen as a key trigger for bearish traders amid a flurry of incoming negative Brexit-related headlines.
“¢ Technical indicators on the 1-hourly chart have been gaining negative momentum and support prospects for a further slide towards challenging 100-hour SMA.
“¢ However, oscillators on 4-hourly/daily charts are still holding in the bullish territory, though have started losing traction, and thus, warrant some caution.
GBP/USD 1-hourly chart
GBP/USD
Overview:
Today Last Price: 1.3251
Today Daily change: -43 pips
Today Daily change %: -0.32%
Today Daily Open: 1.3294
Trends:
Daily SMA20: 1.3149
Daily SMA50: 1.3024
Daily SMA100: 1.2899
Daily SMA200: 1.2982
Levels:
Previous Daily High: 1.3302
Previous Daily Low: 1.3203
Previous Weekly High: 1.3384
Previous Weekly Low: 1.296
Previous Monthly High: 1.3351
Previous Monthly Low: 1.2773
Daily Fibonacci 38.2%: 1.3264
Daily Fibonacci 61.8%: 1.3241
Daily Pivot Point S1: 1.3231
Daily Pivot Point S2: 1.3168
Daily Pivot Point S3: 1.3133
Daily Pivot Point R1: 1.333
Daily Pivot Point R2: 1.3365
Daily Pivot Point R3: 1.3428
