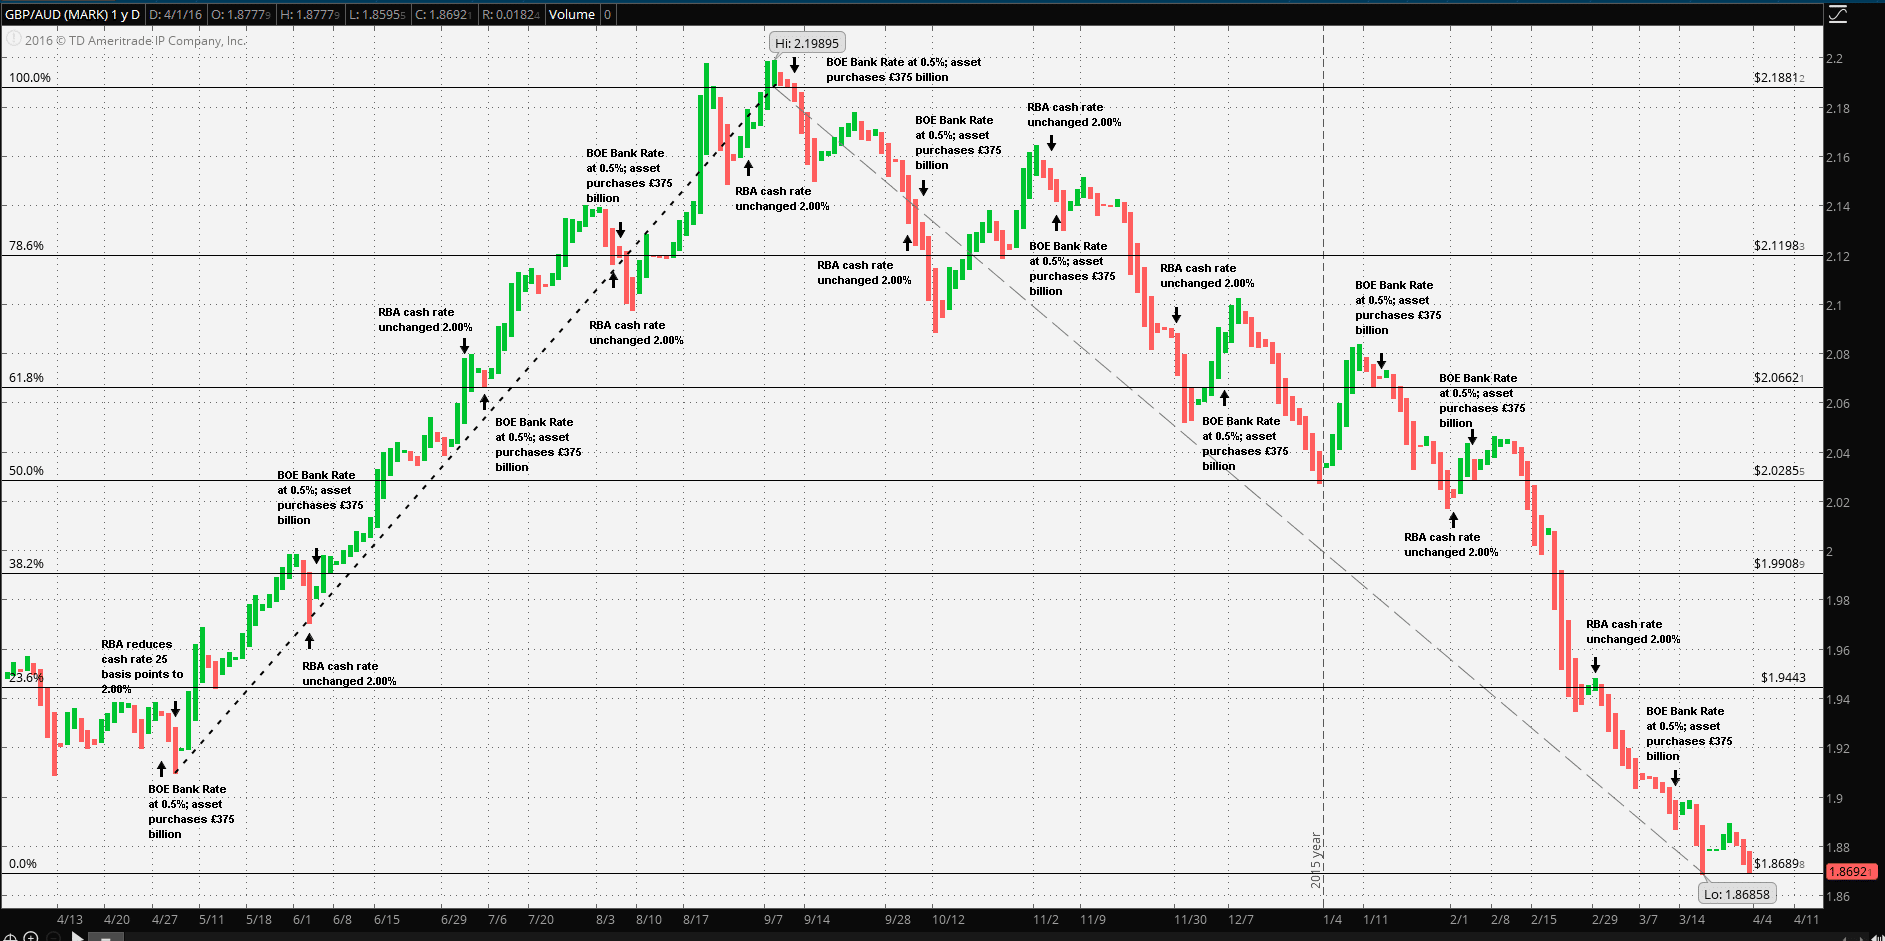
Clearly, one of the most interesting cross charts is that of GBP/AUD. The narrative begins by noting that the Bank of England’s policy has been a relative fixed constant for going back to the financial crises of 2008. The Reserve Bank of Australia has been in a long term easing cycle, beginning in March of 2008, with a 7.25% OCR and the most recent policy change occurring at the 5 May policy meeting to 2.00%. After the May 25 basis point reduction the Aussie began a long weakening trend vs Sterling, a remarkable 15% decline culminating at $2.19895 per Pound Sterling by 8 September, 2015.
After the September Aussie low, the trend didn’t just simply reverse, but rather reversed with a vengeance, regaining all and then some to its 52 weak best at $1.86858 per Pound Sterling (as of 31 March); a 15% gain.
However, it all might be better viewed in two distinct halves: the Aussie weakened against Sterling from May of 2015 through September of 2015 and Sterling weakening against the Aussie from September 2015 through March of 2016.
Guest post by Mike Scrive of Accendo Markets
At the GBP/AUD low of April of 2015, things looked bleak for commodities and Australia was in the thick of the commodity price collapse. One Citicorp analyst humorously referred to the sudden deterioration as ‘the end of the iron age’. What was doubly concerning was that it wasn’t just the collapse in demand, but continued full throttle global production. Even RBA Governor Glenn Stevens had noted the overproduction in several successive RBA statements. “…These trends appear to reflect a combination of lower growth in demand and, more importantly, significant increases in supply…“
On the other hand, the UK economy seemed to be gaining momentum, the reasons for which at the time might not have appeared so clear, but it all registered strong, nonetheless. The UK economy was recovering at a pace sufficient enough for analysts to consider a BOE Bank Rate increase; however, if it happened it would not be until after upcoming elections. There were two key factors driving the UK economy at the time. The first might have been ‘imported deflation’ from its Eurozone trade partners increasing consumer spending power. Second, the ‘Brexit’ referendum appeared to be many months, if not years in the future. However, a convincing conservative party victory changed all that and Prime Minister Cameron discovered that he suddenly had Brexist support that he, perhaps, did not expect to have nor, perhaps, even wished for.
Still, it was far more secure to sell Aussie and buy Sterling even though the Aussie was a far better carry by the 150 basis point spread over Sterling. Neither bank would change policy over the next 12 months. However, political pressure and campaign promise pushed the Brexit issue forward with a definitive referendum set for 23 June. Further, conservative populist and nationalist movements were gaining support throughout Europe in response to waves of immigration, a horrific war in Syria and terrorist attacks and the threat of sleeper cells in Europe. The UK economy was still relatively strong, but the uncertainty of the after effects of a Brexit began to weigh on trader’s minds.
This is clearly demonstrated by the chart. The RBA had been steadfast in their policy since May of 2015 and gave no indication of changing policy in the near future. The policy stance was further reinforced by new regulations restricting mortgage loans, dampening housing prices and thus relieving the RBA from taking any rate actions. The point is that the RBA seemed to have found firm footing in spite of the weakened economy. The April-September 2015 uptrend of the GBP/AUD cross was a function of Aussie uncertainty. Now the tide had turned. It was the increasing Brexit referendum uncertainty and the consequential implications for the UK economy as well as Sterling. Lastly, the premise is reinforced as the UK economy still seemed to be one of the better performing advanced economies and the BOE still maintained it accommodative stance. The trend from September 2015-present is a function of Sterling, or perhaps more specifically, Brexit.
Sterling’s downhill slide was gaining momentum vs the Aussie. It had gone from stability, over the crest and then to worrisome as noted by Mr. Simon Derrick, Chief UK Currency Strategist, Bank of New York Mellon: “… I’ve had more people ask me about sterling in the last four or five weeks than I’ve had in six months… …People are starting to think about these things in 2016, and how it impacts sterling…” This was further noted by Ian Stannard, Foreign Exchange Strategist at Morgan Stanley: “…While it’s our base case that the U.K. will vote to stay in the EU, the uncertainty leading up to the referendum will be negative because that will likely slow investment inflows into the U.K….”
It’s also interesting to note the short gain during the Asian market turmoil in the first days of 2016, but the downhill roll resumed shortly afterwards, possibly an indication that Sterling lost favor as a flight to quality trade. The reversal would continue to its present $1.8689 Aussie per Pound Sterling at its 52 week low (23 March), and slightly below the $1.9096 when the April- September 2015 strengthening trend began.
Lastly, the events such as the Belgium attacks as well as several terrorist attacks in Turkey will only increase trader’s concerns that increasingly more “undecideds” will begin to consider Brexit.
If the RBA is confident with its current policy, and the BOE ready to cut rates in the event of a “pro” Brexit vote, it’s like that the GBP/AUD cross will react to news events far more than central bank actions.
“CFDs, spread betting and FX can result in losses exceeding your initial deposit. They are not suitable for everyone, so please ensure you understand the risks. Seek independent financial advice if necessary. Nothing in this article should be considered a personal recommendation. It does not account for your personal circumstances or appetite for risk.“
