The collapse of GBP/USD started with the dovish meeting minutes of the MPC, and turned into an avalanche, with an extra push of a dollar-loving market following the minutes of the Federal Reserve on the other side of the Atlantic.
The fall eventually led it to levels last seen in July 2010 – lows of over a 2.5 years. At 1.5170, we can already look at the bigger levels on a long term chart.
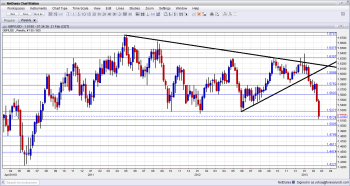
Looking at the weekly chart, the next obvious line is 1.50 – this is a very round number and it also worked as support in early 2010. James Chen also marks this line: GBP/USD Continues Bearish Trend Towards 1.5000.
Yet before this line, we have 1.5124 – at the time of writing, the pair stopped at this line, and this isn’t totally by chance: the line provided support in the spring of 2010, as we can see on the far left side of the chart.
Below 1.50, the round 1.48 line provides further support: it was a swing low in back in early 2010, and also worked temporarily as resistance when the pair traded in lower ground. Further below, 1.4610 capped cable in May and June 2010.
1.4475 was a swing low in May 2010 and the last line before the big trough of 1.4227 – this bottom of May 2010 is the lowest level since the post-crisis recovery.
Even lower, we have levels that were recorded in late 2008 / early 2009, which are still far, yet we can mention the post-crisis low of 1.3514 as a far target.
On the topside, the previous low of 1.5235 seen in January 2012 was broken quite easily as a follow through the break of 1.5270. The latter is a more important line, and it served as support in mid-2012, mid-2012 and also in 2010. This will be a strong line of resistance on any recovery attempt.
Further above, 154 serves as resistance, followed by 1.56 which is of higher importance. Also note the uptrend support line, which was broken back in January. The pair has been on a slippery slope since then.
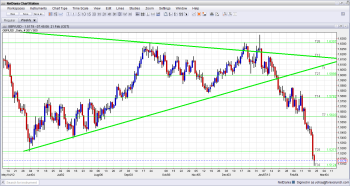
The break of this line was mentioned in the February monthly outlook, which you can download by joining the newsletter below. And, here’s one more look at the big fall, using the daily chart.
For more on the British pound, see the GBP/USD forecast.
