Cable managed to pop higher and close above 50-day simple moving average during last week. GBPUSD dipped yesterday after disappointing UK manufacturing PMI figures, and fell close to 50-day SMA where buyers reemerged.
In the short term, it looks like GBPUSD pair is heading towards a critical break.
UK Manufacturing PMI
During the yesterday’s European session, UK Manufacturing Purchasing Managers Index (PMI) was released by both the Chartered Institute of Purchasing & Supply and the Markit Economics. The outcome was disappointing, as Manufacturing PMI was down from 56.2 to 55.3, missing the forecast of 56.7. The previous reading was also revised lower from 56.9 to 56.2. This is lowest seasonally adjusted Markit/CIPS PMI in the last eight months. However, the report mentioned that “the PMI nonetheless remains well above its long run average of 51.4 and has highlighted an improvement in operating conditions in each of the past 12 months”. GBPUSD dived towards 1.6620 level in an early reaction, but later managed to recover some ground.
UK Nationwide HPI
Today at GMT 06:00 AM, UK’s Nationwide Housing Price Index (HPI) data will be published. The forecast is slated for an improvement, and if outcome does not disappoint, then GBPUSD might find buyers Intraday.
Technical Analysis
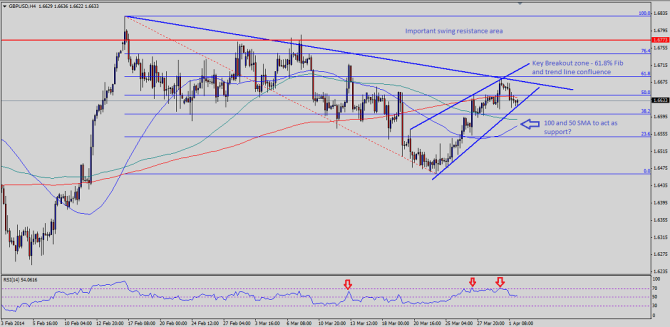
GBPUSD has managed to hold 50-day SMA after yesterday’s decline. There is a triangle forming on the 4 hour timeframe, and GBPUSD is testing triangle support as of writing. It’s important to note that recent rally failed around a critical juncture. The buyers failed to take the pair higher above 61.8% Fibonacci retracement level of the last leg lower from 1.6828 high to 1.6462 low. There is a confluence of two trend lines meeting around the same level, which increases the significance of resistance. A break above this zone might encourage buyers to take the pair higher.
On the downside, triangle support area holds a lot of importance, as a break below might take the pair lower. 50 and 100 SMA confluence zone on 4 hour timeframe might act as a barrier for sellers after the break. There are divergence noted on RSI between last three highs, which is a negative sign.