The British pound changed directions last week gaining about 100 points. GBP/USD closed the week at 1.6065. This week’s key events are CPI, Average Earnings Index and Claimant Count Change. Here is an outlook on the major events moving the pound and an updated technical analysis for GBP/USD.
British releases were uneventful last week, and the BoE held steady with its monetary policy. In the US, the dollar softened after unexpectedly dovish FOMC minutes, where the central bank expressed concern about the recent strength of the dollar against its major rivals.
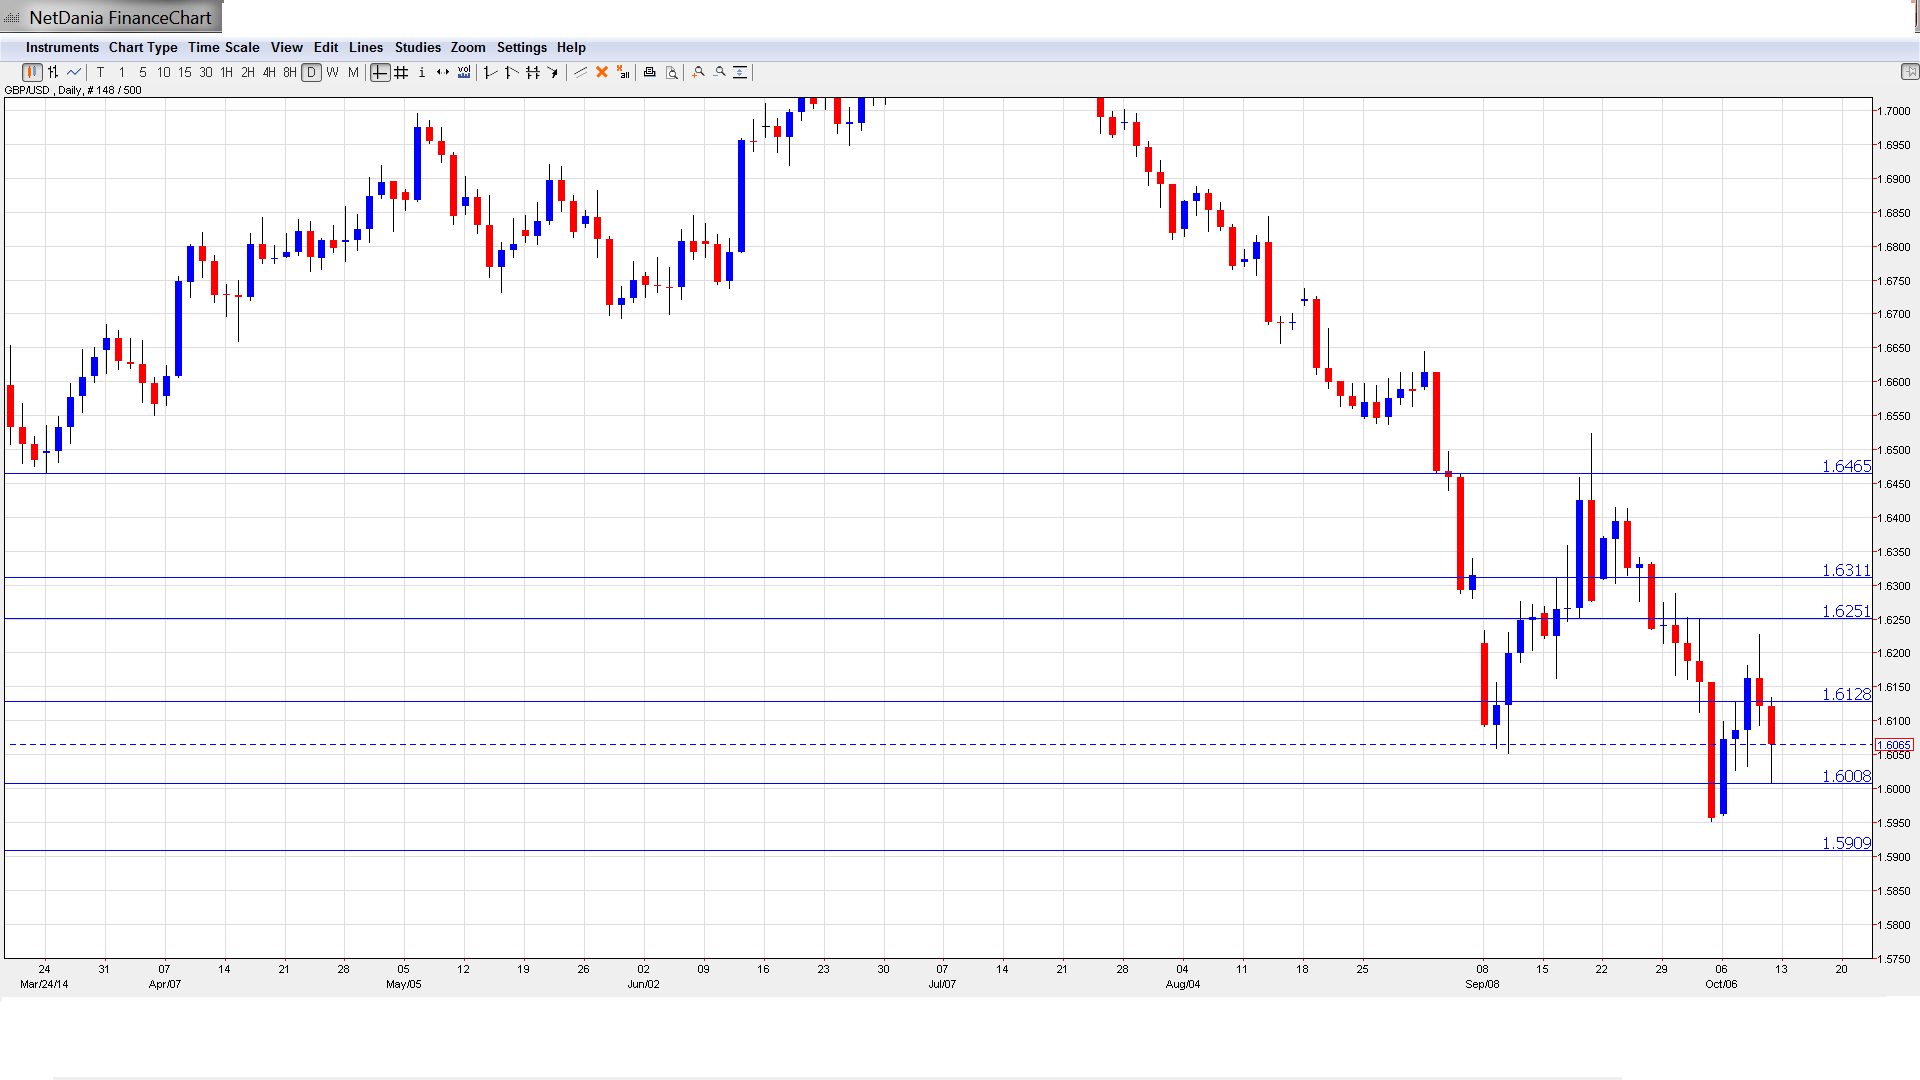
GBP/USD graph with support and resistance lines on it.
- BRC Retail Sales Monitor: Monday, 23:01. The indicator measures the change in retail sales in BRC stores. After two straight declines, the indicator posted a gain of 1.3% in August.
- CPI: Tuesday, 8:30. CPI is the primary gauge of consumer inflation. The indicator has been falling in recent releases, posting an annual gain of 1.5% in the previous release. Little change is expected in the September reading, with an estimate of 1.4%.
- PPI Input: Tuesday, 8:30. This index measures the change in inflation in the manufacturing sector. The indicator has failed to post a gain in 2014, and declined by 0.6% last month, short of the estimate of +1.0%. Another decline is expected in the September release, with a forecast of -0.4%.
- Average Earnings Index: Wednesday, 8:30. This key event is a leading indicator of consumer inflation. The indicator posted a gain of 0.6% in the previous reading, a 3-month high. The markets are expecting another good release this week, with the estimate standing at 0.7%.
- Claimant Count Change: Wednesday, 8:30. Claimant Count Change is one of the most important indicators on the calendar, and can have a significant impact on the movement of GBP/USD. The indicator has been posting sharp declines, underscoring the improving job market in the UK. Another excellent reading is expected for September, with an estimate of -34.2 thousand.
* All times are GMT
GBP/USD Technical Analysis
GBP/USD opened the week at 1.5962 and touched a low of 1.5960. The pair then climbed to a high of 1.6227, as resistance held firm at 1.6250 (discussed last week). The pair closed at 1.6065.
Live chart of GBP/USD:
[do action=”tradingviews” pair=”GBPUSD” interval=”60″/]Technical lines from top to bottom
We start with resistance at 1.6465, which was the bottom in March. Further below, the round number of 1.64 is providing resistance.
1.6310, the next resistance line, was a cushion during January.
This is followed by 1.6250 which remained intact as GBP/USD flexed some muscle before retracting.
1.6131 was breached but then recovered and remains a resistance line.
This is followed by 1.6006, just above the psychologically important 1.60 level. This line has switched to a support role as the pound trades at higher levels.
1.5909 is the next support level. It has held firm since November 2013.
Next is 1.5746, which was an important support line in January 2013.
The final support line for now is 1.5422.
I am neutral on GBP/USD.
The markets are expecting interest rate hikes in 2015 in both the US and UK, so key releases could impact on the timing of such a move by the BoE and Federal Reserve. Much will depend on this week’s CPI and Claimant Count Change releases – if they meet expectations, the pound could hold its own against the US dollar.
Further reading: Who will raise interest rates first – the US or UK?
Further reading:
- For a broad view of all the week’s major events worldwide, read the USD outlook.
- For EUR/USD, check out the Euro to Dollar forecast.
- For the Japanese yen, read the USD/JPY forecast.
- For GBP/USD (cable), look into the British Pound forecast.
- For the Australian dollar (Aussie), check out the AUD to USD forecast.
- USD/CAD (loonie), check out the Canadian dollar.
