GBP/USD had another excellent week, as the pound gained close to two cents against the dollar. The pair crossed the 1.56 line for the first time since mid-June and closed the week at 1.5624. This week’s major release is Second Estimate GDP. Here is an outlook of the events and an updated technical analysis for GBP/USD.
The surging pound was buoyed by some strong UK data this week. Claimant Count Change posted its largest decrease in claims in almost three years and Retail Sales posted a sharp gain. In the US, there was mixed data as Unemployment Claims looked sharp but manufacturing numbers faltered and consumer confidence numbers disappointed.
[do action=”autoupdate” tag=”GBPUSDUpdate”/]GBP/USD graph with support and resistance lines on it. Click to enlarge: 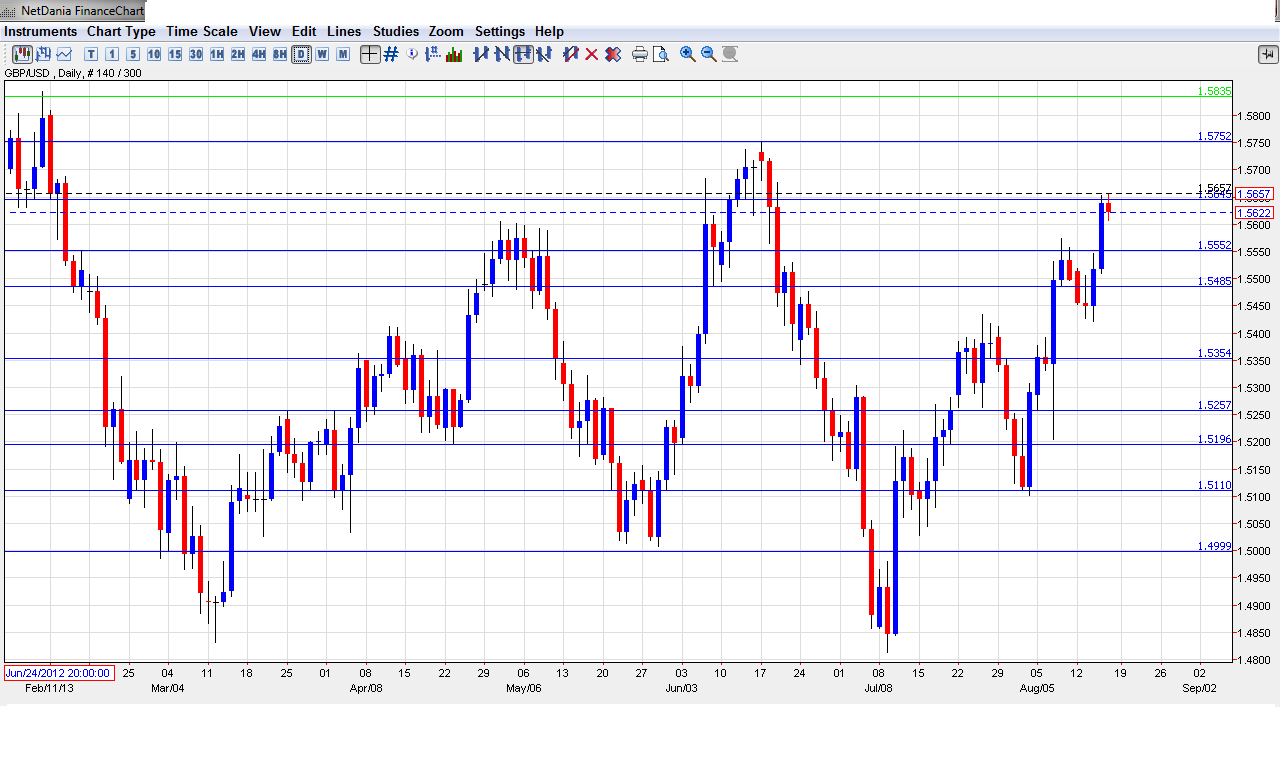
- Rightmove HPI: Sunday, 23:01. This housing inflation index has shown little consistency, with strong fluctuations in both directions. The index posted a weak increase of 0.3% in July, its smallest gain since January. The markets will be hoping for a turnaround in the upcoming release.
- Public Sector Net Borrowing: Wednesday, 8:30. The indicator did not show much change in July, posting a deficit of 10.2 billion pounds. The estimate stood at 9.4 billion. The markets are expecting a surplus in August, with an estimate of -4.8 billion pounds. If the indicator can produce a surplus in the upcoming release, it will be for just the second time in 2013.
- CBI Industrial Order Expectations: Wednesday, 10:00. This manufacturing indicator is based on a survey of manufacturers, who are asked whether they expect an increase in the volume of orders. The index has been mired deep in negative territory for quite some time, although it has been improving, and the July reading of -12 points was the index’s best showing in 2013. Will the upward trend continue in August?
- Jackson Hole Symposium: Thursday-Saturday. The Jackson Hole Symposium in Wyoming is an important economic conference attended by central bankers, finance ministers, financial market participants and academics from around the world. With speculation that the Fed could taper QE as early as September, the conference could be prove to be a market-mover and will be carefully monitored by analysts.
- Second Estimate GDP: Friday, 8:30. GDP, which is released each quarter, is the broadest measure of economic activity and often has a major impact on the movement of GBP/USD. Second Estimate GDP for Q2 follows Preliminary GDP, which was released in late July. Preliminary GDP for Q2 came in at 0.6%, and this is the estimate as well for Second Estimate GDP.
- BBA Mortgage Approvals: Friday, 8:30. Mortgage Approvals provides an excellent gauge of the health of the UK housing sector. The indicator has gained steadily over the past three releases, although the July reading of 37.3 thousand fell short of the estimate of 38.5 thousand. The markets are expecting the upward trend to continue, with an estimate of 39.2 thousand. If the indicator can match or beat the estimate, it would be the highest reading in over three years, and could give the pound a boost.
- Preliminary Business Investment: Friday, 8:30. This quarterly release looks at the amount of capital investment made by businesses and the government. The indicator has not looked sharp lately, with three declines in the past four releases. The Q1 release posted a decline of -0.4%, well off the estimate of 1.7%. The markets are expecting a strong turnaround in the Q2 release, with the forecast standing at 0.6%.
Live chart of GBP/USD: [do action=”tradingviews” pair=”GBPUSD” interval=”60″/]
GBP/USD Technical Analysis
GBP/USD opened the week at 1.5455. The pair dropped to a low of 1.5422 but then rebounded strongly, climbing all the way to a high of 1.5657, breaking through resistance at 1.5648 (discussed last week) along the way. GBP/USD closed the week at 1.5624.
Technical lines from top to bottom:
We begin with resistance at 1.6154 , which was last tested in January. This line marked the high point as the GBP/USD went on a sharp slide which saw the pound drop below 1.49.
1.5962 saw a lot of activity in February and March 2012 and has stayed in place since mid-January.
1.5832 was busy in late January and has remained in place as a resistance line since February. 1.5752 was last breached in June, marking the peak of a rally by the pound which started in May.
1.5648 saw a lot of activity in June and continues to provide resistance. This line was breached late in the week as the pound posted strong gains, but remained intact at week’s end.
1.5550 saw action in mid-June, as GBP/USD pushed past this line and climbed as high as the mid-1.5750 range. It is currently providing the pair with support.
1.5484 was breached in June, as the pound went on a sharp skid that saw it drop below the 1.49 line. 1.5350 has strengthened in support as GBP/USD continues to move upwards.
1.5258 has some breathing room as GBP/USD trades at higher levels.
1.5196 is the next line of support. It saw action in mid-July and again in the first week of August.
1.5110 was busy in July but has had a quiet August as the pair has climbed to higher levels.
1.5000 is the final support level for now. It is a critical support line, and has remained in place since early July.
I am neutral on GBP/USD.
The pound enjoyed another strong week at the expense of the US dollar, as UK employment and retail sales data looked sharp. Will the pair’s upward rally continue? US employment numbers have looked solid and this is bound to increase speculation about QE tapering, which would be bullish for the dollar.
Further reading:
- For a broad view of all the week’s major events worldwide, read the USD outlook.
- For EUR/USD, check out the Euro to Dollar forecast.
- For the Japanese yen, read the USD/JPY forecast.
- For the Australian dollar (Aussie), check out the AUD to USD forecast.
- For USD/CAD (loonie), check out the Canadian dollar forecast.
