GBP/USD posted gains during the week, but fell sharply on Friday, and was down close to a cent at week’s end. The pair closed at 1.5691.The upcoming week is quite busy, with 10 events. Here is an outlook of the events and an updated technical analysis for GBP/USD.
The pound got hit with a double-whammy on Friday, as weak UK Manufacturing data combined with strong an excellent Manufacturing PMI out of the US pushed the pair down sharply.
Updates: Construction PMI was a disappointment, coming in at 48.7 points. This was below the estimate of 49.7 points. BRC Retail Sales Monitor climbed 1.9%. Services PMI looked sharp, improving to 51.5 points. This easily beat the estimate of 49.8 points. BRC Shop Price index gained 0.6%, its weakest showing since December 2009. Halifax HPI declined 02%, matching the estimate. Manufacturing Production, a key index, jumped 1.6%. This was well above the estimate of 0.7%. The Trade Deficit narrowed to -8.9 billion pounds, matching the estimate. Industrial Production climbed 1.1%. The estimate stood at.0.7%. BOE Governor-Designate Mark Carney testified before the Treasury Select Committee. Carney will take over as BOE Governor in July. There were no surprises from the BOE, as interest rates remain at 0.50%, and QE continues to be pegged at 375 billion pounds. GBP/USD has moved higher, and broke above the 1.57 line. The pair was trading at 1.5716.
GBP/USD graph with support and resistance lines on it. Click to enlarge: 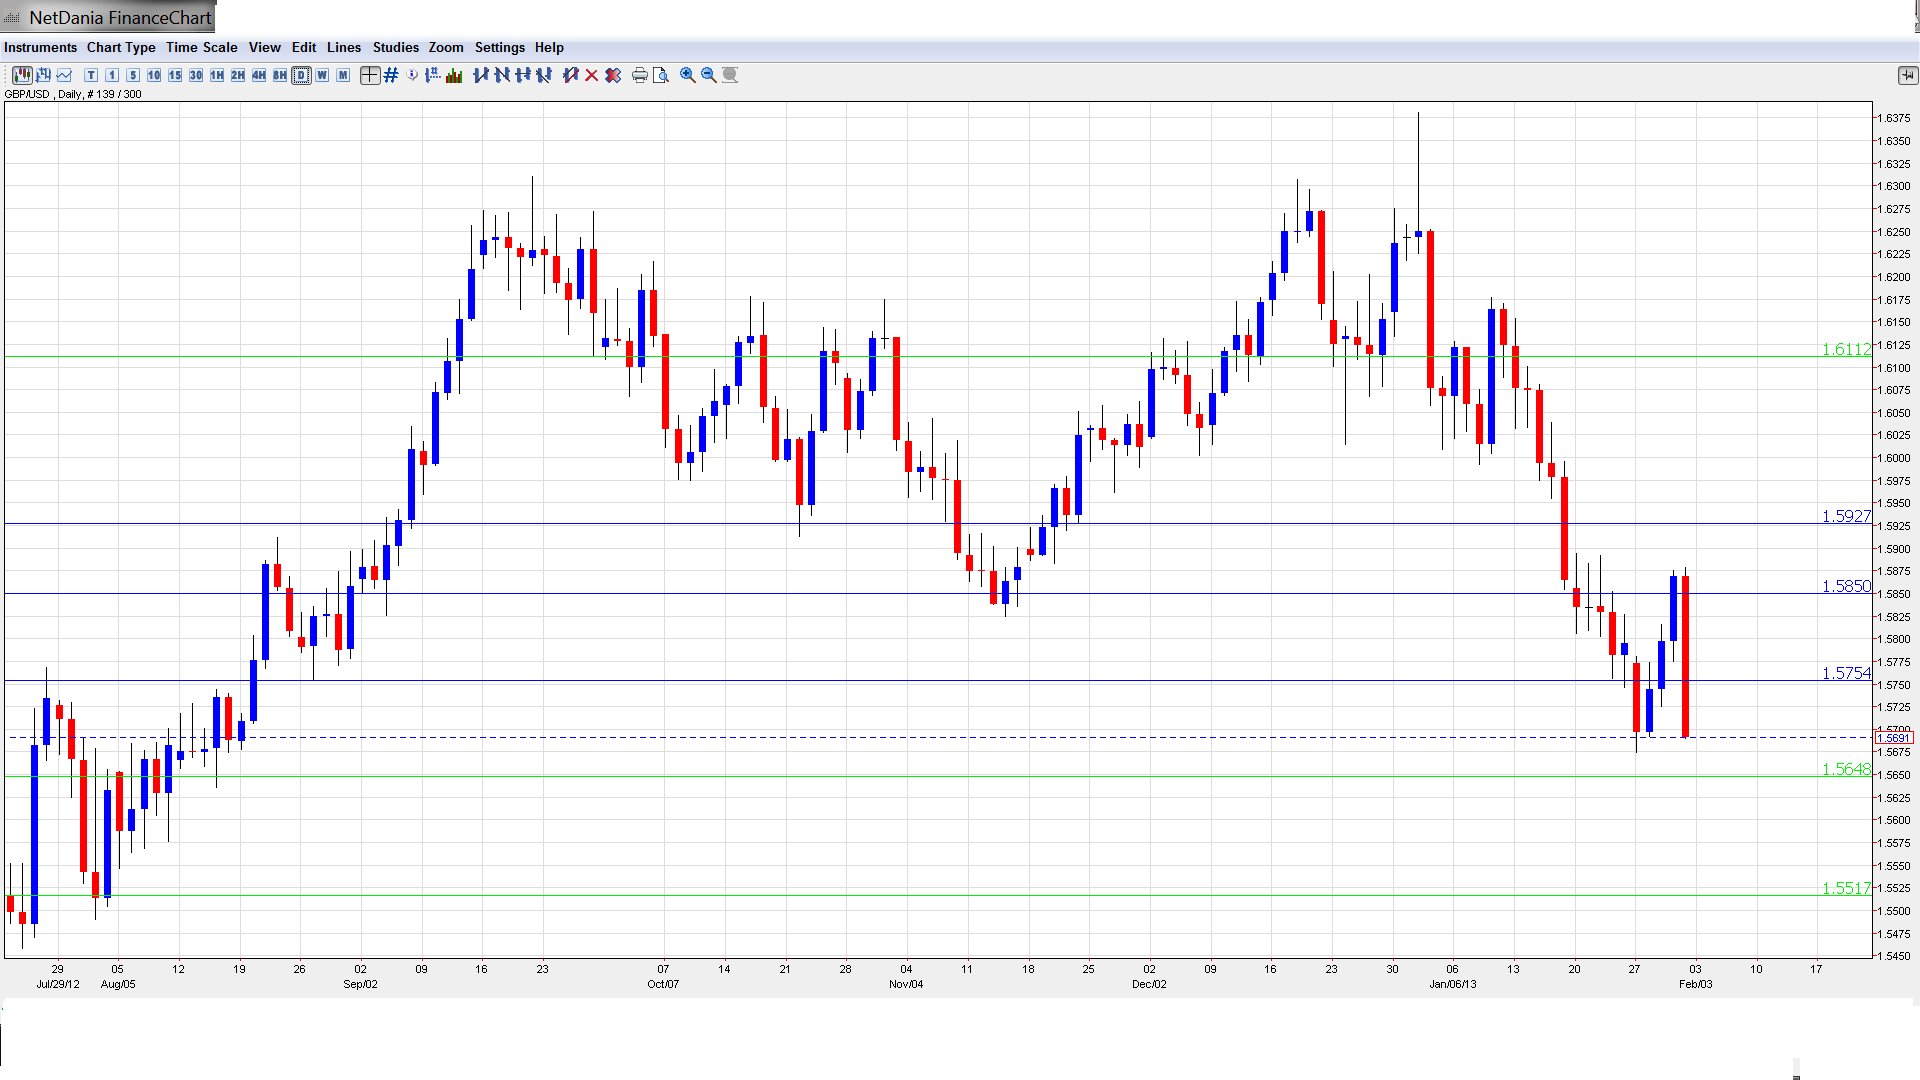
- Construction PMI: Monday, 9:30. This key index climbed to 49.7 points in the previous reading, but spent most of the latter half of 2012 below the 50 line, pointing to contraction in the construction industry. Will the index push above the 50 level in the upcoming reading?
- BRC Retail Sales Monitor: Tuesday, 00:01. This indicator looks at retail sales in the BRC chain of stores. The indicator posted a 0.3% gain in January, the second straight rise. The markets will be hoping the positive trend continues in February.
- Halifax HPI: Tuesday, 5th-7th. This housing inflation index jumped 1.3% in January, a nine-month high. The markets are bracing for a much weaker release in February, with an estimate of -0.2%.
- Services PMI: Tuesday, 9:30.This index was a disappointment in January, surprising the markets with the first release under the 50 point level in two years. The markets are hoping that the index will rebound in the upcoming reading.
- BRC Shop Price Index: Wednesday, 00:01. This consumer inflation indicator is based on data from the BRC chain of stores. The indicator has posted a reading of 1.5% for the past three releases.
- Manufacturing Production: Thursday, 9:30. This key indicator has recorded two consecutive declines, both of which were well below the market estimate. The markets are anticipating a turnaround, with an estimate of 0.7%.
- Trade Balance: Thursday, 9:30. The monthly trade deficits have not looked sharp, with three of the past four releases surpassing a 9 billion pound deficit. The markets are expecting some modest improvement in the February release.
- Asset Purchase Facility: Thursday, 12:00. This key indicator measures QE, the amount of funds that the BOE uses to purchase assets on the open market. The indicator has been pegged at 375 billion pounds since June 2012, and no change is expected in the upcoming release.
- Official Bank Rate: Thursday, 12:00. The benchmark interest rate has held steady since 2009, and any change to the rate would quickly be felt by GBP/USD. The markets are not expecting any changes by the BOE to the current rate.
- NIESR GDP Estimate: Thursday, 15:00. GDP, which is officially released each quarter, is one of the most important economic indicators, and is closely monitored by the markets. Analysts utilize this monthly indicator in order to track the quarterly GDP. The indicator declined by 0.3% in January, its first decline since August. Will the indicator rebound into positive territory in February?
*All times are GMT
GBP/USD Technical Analysis
GBP/USD opened the week at 1.5774. The pair dropped to a low of 1.5674, but then climbed all the way to 1.5879, as it broke through support at 1.5850 (discussed last week). GBP had a rocky end to the week, falling to 1.5691.
Technical lines from top to bottom:
We start with resistance at 1.6247. This line has held firm since early January, when the pound began a slide from which it is yet to recover. This is followed by 1.6122. Next, there is resistance at 1.6060. This is followed by 1.5992, just below the psychologically significant number of 1.60.
Below, 1.5930 is providing resistance. This is followed by 1.5850, which was briefly breached as the pound flexed some muscle during the week, before taking a sharp dive at the end of the week. Next, 1.5750 is now in a resistance role after providing support. This line saw a lot of action this past week, and this could continue.
GBP/USD is receiving support at 1.5648. Next is the line of 1.5516, which has held steady since August of last year. This is followed by support at 1.5406. Below, there is support at 1.5361, which has held firm since June 2012. The pound started a rally at that time, which lasted until last September. The final support level for now is at 1.5282.
I remain bearish on GBP/USD.
Nothing seems to have gone right for the pound in January, which shed about five cents against the US dollar during that time. The downward spiral could continue if UK numbers continue to point to a sluggish British economy. The US recovery may be bumpy, but is certainly much stronger than what we’re seeing out of the UK.
Further reading:
- For a broad view of all the week’s major events worldwide, read the USD outlook.
- For EUR/USD, check out the Euro to Dollar forecast.
- For the Japanese yen, read the USD/JPY forecast.
- For the Australian dollar (Aussie), check out the AUD to USD forecast.
- For USD/CAD (loonie), check out the Canadian dollar forecast.
