GBP/USD gained about one cent on the week, as the pair closed above the 1.56 line. This week’s major events include Claimant Count Change and the Inflation Report Hearings. Here is an outlook of the events and an updated technical analysis for GBP/USD.
British PMIs from the services, manufacturing and construction sectors all looked sharp this week. As well, NIESR GDP posted a strong gain, as the British economy continues to show signs of improvement. In the US, PMIs looked solid, but the critical Non-Farm Payrolls disappointed.
[do action=”autoupdate” tag=”GBPUSDUpdate”/]GBP/USD graph with support and resistance lines on it. Click to enlarge: 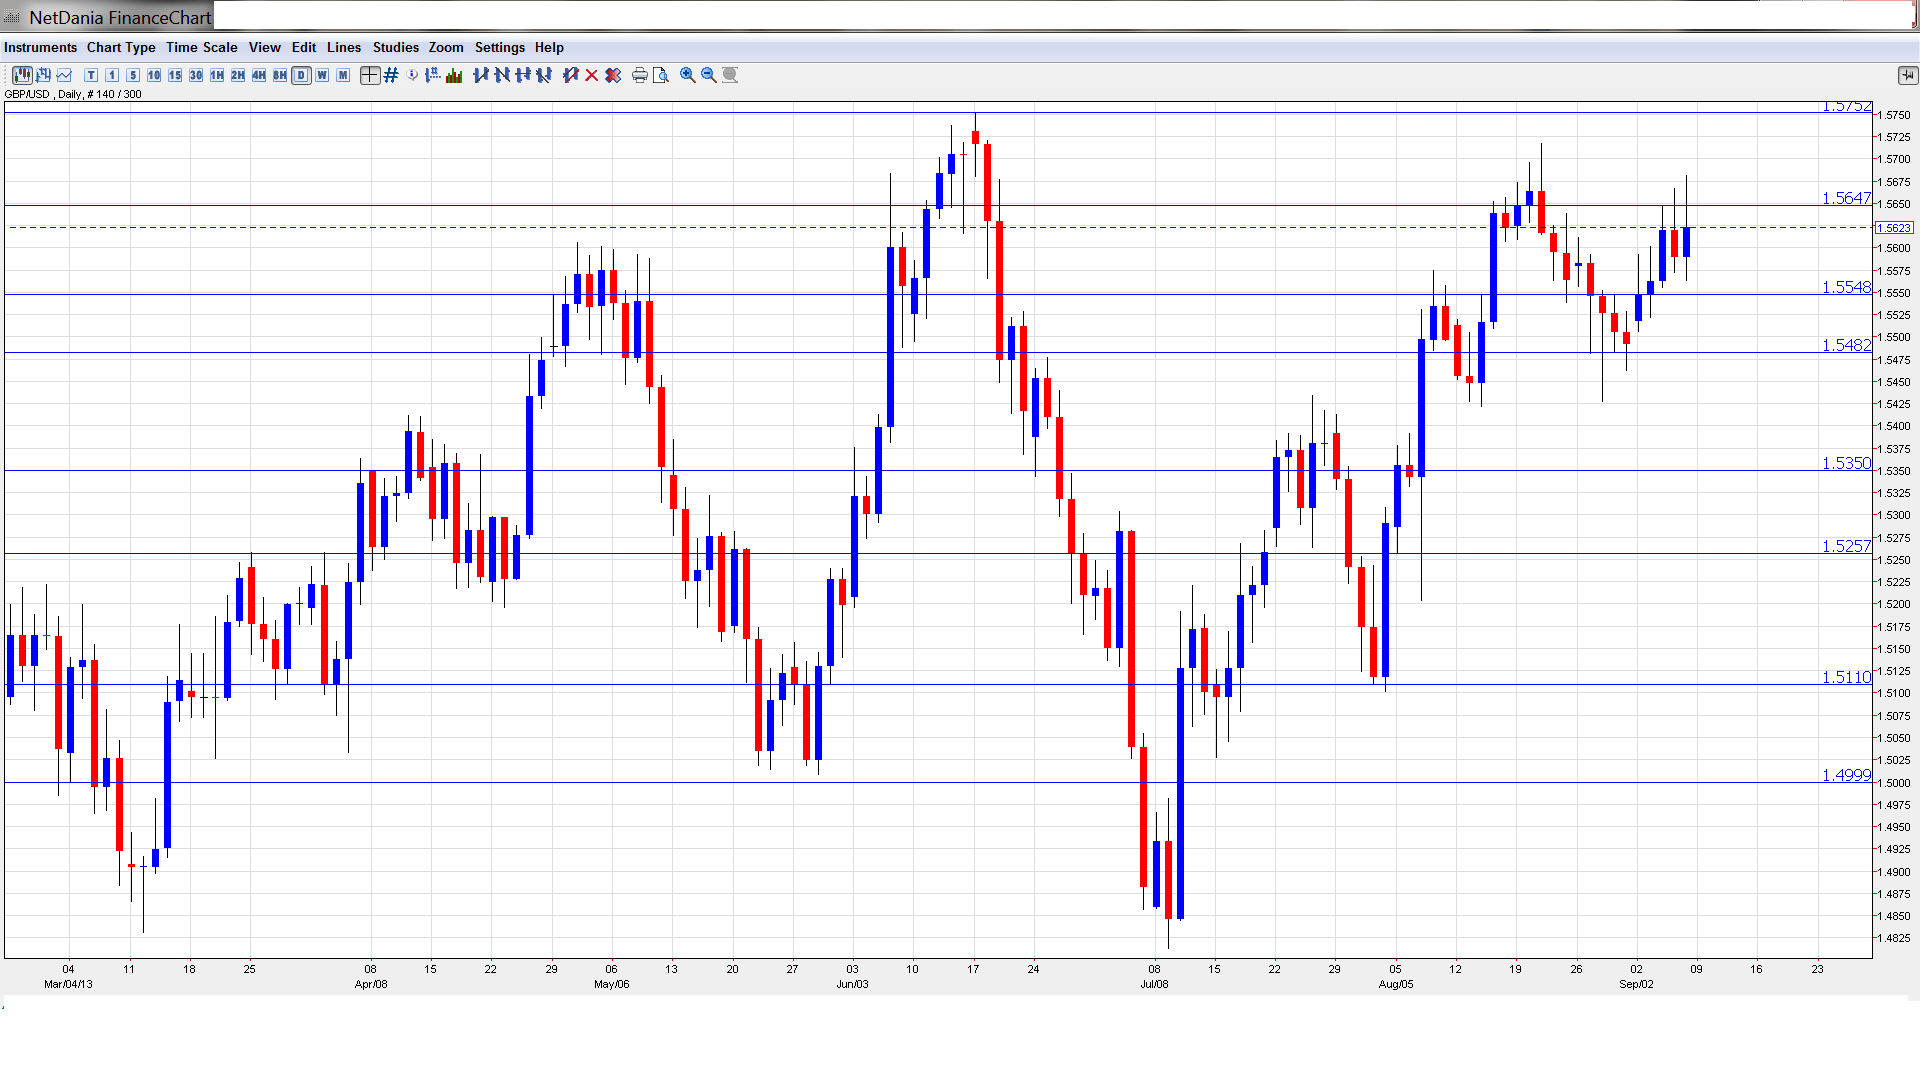
- RICS House Price Balance: Monday, 23:01. This indicator looks at the price increases reported by surveyors and is an important measure of inflation in the housing sector. The indicator has been showing sharp increases – from 1% in April to 36% in July. The estimate for August stands at 38%.
- BOE Credit Conditions Survey: Tuesday, 8:30. This important report is released each quarter, magnifying its impact. It includes data on lending to consumers and businesses. An increase in lending is a sign that lenders are comfortable issuing loans and that consumers and businesses are more confident about spending.
- Claimant Count Change: Wednesday, 8:30. This key release measures the numbers of unemployment claims each month. The indicator continues to post declines, and last month’s release came in at -29.2 thousand, well below the estimate of -14.3 thousand. Another strong reading is expected in the upcoming release, with an estimate of -21.2 thousand. The Unemployment Rate is expected to remain at a level of 7.8%.
- Average Earnings Index: Wednesday, 8:30. Average Earnings measures the change in price that businesses and the government are paying for labor. The index jumped to 2.1% in July, the highest reading in over two years. The estimate for August stands at 1.3%.
- CB Leading Index: Wednesday, 9:00. This index is based on 7 economic indicators, but is a minor release since most of the indicators have already been released. In July, the index posted its first decline of 2013, with a reading of -0.2%. The markets are hoping to see a gain for August.
- External BOE MPC Member David Miles Speaks: Wednesday, 15:30. Miles will speak at a finance conference in London. MPC members vote on where to set the BOE’s key interest rate, and analysts will be looking for clues about future monetary policy.
- Inflation Report Hearings: Thursday, 9:00. BOE Governor Mark Carney and MPC members will testify about inflation and economic conditions before Parliament’s Treasury Committee. This is a key event, and we could see market volatility during the hearings, especially if there are comments about the currency markets.
Live chart of GBP/USD: [do action=”tradingviews” pair=”GBPUSD” interval=”60″/]
GBP/USD Technical Analysis
GBP/USD opened the week at 1.5517. The pair dropped to a low of 1.5606 but then rebounded sharply, climbing to a high of 1.5681, and breaking past resistance at 1.5648 (discussed last week). GBP/USD closed the week at 1.5623.
Technical lines from top to bottom:
We start with resistance at 1.6125. This line has held firm since January, when the pound went on a sharp skid that saw it drop below the 1.50 level.
1.60, a key psychological barrier, is the next line of resistance. This line was last tested in mid-January, when the pound went on a sharp slide that saw it fall below the 1.49 line.
1.5944 saw a lot of activity in November 2012 and this past January.
1.5832 was busy in late January and has remained in place as a resistance line since February. 1.5752 was last breached in June, marking the peak of a rally by the pound which started in May.
1.5648 saw a lot of activity in June and continues to provide resistance. For the second straight week, the line was breached as GBP/USD moved higher, but remained intact at the end of the week.
1.5550 is providing GBP/USD with support. This line saw action in mid-June, as GBP/USD pushed past this line and climbed as high as the mid-1.5750 range.
1.5484 has strengthened in support as the pair trades at higher levels. It was quite busy in August.
1.5350 saw some action in the first week in August, when the pound started a rally that saw it climb above the 1.57 line.
1.5258 is the next line of support. 1.5196 saw action in mid-July and again in the first week of August.
1.5110 was busy in July but has had a quiet August as the pair continues to trade at higher levels.
1.5000 is the final support level for now. It is a critical support line, and has remained in place since early July.
I am neutral on GBP/USD.
The pound had a strong week, buoyed by strong PMI releases. The UK economy is picking up steam, which is good news for the pound. Over in the US, the Federal Reserve hasn’t given many clues as to when it might begin QE tapering, but speculation is increasing that the Fed could take action later in September. As well, market sentiment remains positive about the US economy.
Further reading:
- For a broad view of all the week’s major events worldwide, read the USD outlook.
- For EUR/USD, check out the Euro to Dollar forecast.
- For the Japanese yen, read the USD/JPY forecast.
- For the Australian dollar (Aussie), check out the AUD to USD forecast.
- For USD/CAD (loonie), check out the Canadian dollar forecast.
