GBP/USD failed to dip below the psychological area of 1.6000 during Thursday’s European session, despite the disappointing retail sales data. On Friday UK QoQ GDP rose 0.7% in Q3 in line with expectations, however weaker than Q2’s QoQ +0.9% expansion. Although fundamentally slowing in Economic growth raise concerns regarding GBP, it enables us to believe that the BOE is unlikely to raise rates in the upcoming months, especially ahead of the upcoming general elections in May.
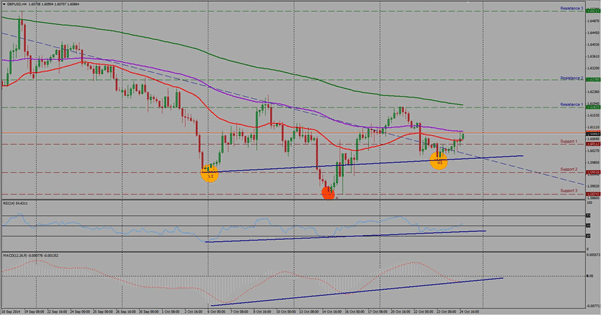
As the GDP figures came in line with previous expectations Cable recovered from its psychological 1.60 level. With the fading bearish momentum, the newly forming higher lows and bullish divergence on both RSI and MACD we can expect short-term recovery from GBP towards 1.6280 as the pair is forming a potential inverse Head and Shoulder pattern as well.
Expectations for the upcoming week (Oct 27th – Oct 31st):
At the time of analysis the pair is trading just above its weekly support line of 1.6050 (Support1) and between SMA20 (sloping upwards) and SMA50 (flat). A clear and decisive breakout above SMA50 would indicate bullish trend development towards R1@ 1.6180 and [email protected] levels. The overall current trend is sideways with bullish technical bias. Meanwhile, may we see a break below 1.6000 psychological support level during the week the pair would potentially move towards 1.5950 and 1.5880 levels as its next support levels.
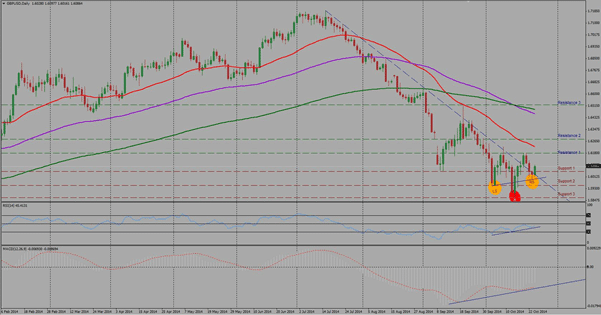
As per the previous week’s view also on daily timeframe may our short-term support levels be broken we could see the Sterling moving towards 1.5760 and 1.5600 long-term support levels, which had been key support and resistance levels in 2013.
Since the market is in consolidation mode with strong bullish divergence on both of our indicators, it is recommended to avoid short entries and wait for the confirmation of the inverse H&S pattern to enter long positions.
Resistance levels: 1.6180, 1.6280 and 1.6520
Support levels: 1.6050 (1.6000 being psychological support zone), 1.5950 and 1.5875