GBP/USD (daily chart as of June 3, 2015) broke down below the 100-day EMA (bold blue moving average line on chart) on June 1, but immediately rebounded yesterday (red arrow 3 on chart) with a long bullish candlestick showing potentially strong support at this important level.
The most recent testing of this 100-day EMA occurred in early May (red arrow 2 on chart). The pair broke out above the moving average line on May 5 and reached a new high around 1.5805 since the April low. Note also that the RSI is making a lower low while the pair is forming a higher low, which is a potential positive reversal signal.
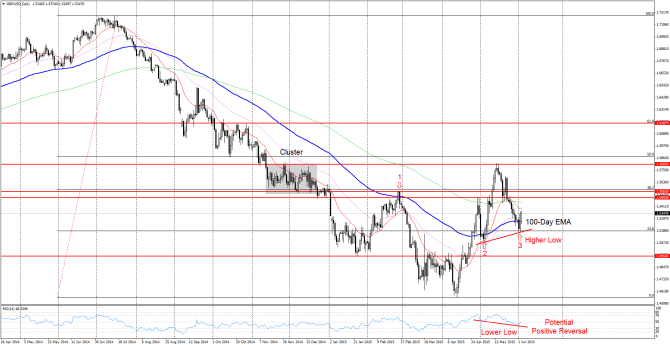
GBP/USD failed to break out above the 100-day EMA on February 26 (red arrow 1 on chart). Watch closely the price action against the 100-day EMA. If this moving average remains as support and the RSI moves above 50, price could trade higher to test 1.5500-1.5550 area, and potentially 1.5805 level.
To the downside, if price cannot hold the 100-day EMA, more downward pressure would be expecting for the following trading sessions. Price could decline to test 1.4950 area again.
Support levels:
S1: 100-day EMA
S2: 1.5085 (May 5 low)
S3: 1.4950 (multiple highs and lows)
Resistance levels:
R1: 1.5500-50 (multiple highs)
R2: 1.5800 (May 14 high)
R3: 1.5880 (Fibonacci 50% retracement level)
Post by Diane Ming, Contributing Author of InvestingTeacher.com. She is an Affiliate Member of the Market Technicians Association (MTA).
Upcoming event risks:
Thursday June 4, 7:00am — GBP Official Bank Rate
Thursday June 4, 8:30am – USD Unemployment Claims
Friday June 5, All Day — OPEC Meetings
Friday June 5, 8:30am – USD Non-Farm Employment Change
