- Gold prices drop from monthly high, stays above short-term key support confluence.
- An upside break will need to be validated by $1,600.
- Break below $1,573 confirms short-term rising wedge bearish formation.
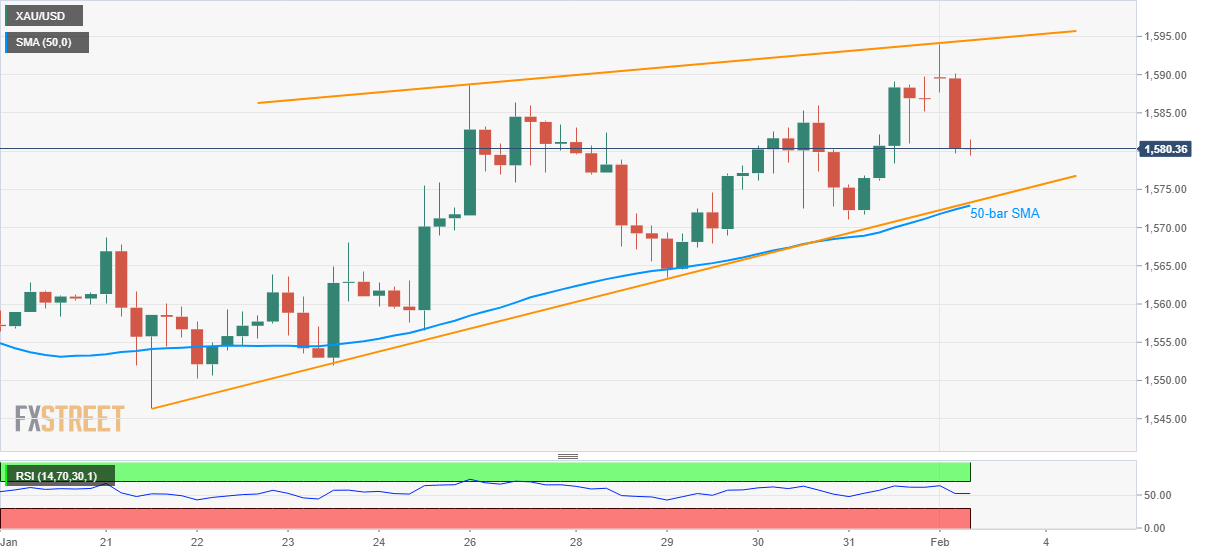
Gold prices decline to $1,580 ahead of the European session on Monday. The bullion initially surged to the highest since January 08 but couldn’t rise farther than $1,594 and witnessed a pullback. Even so, the bullion stays above the short-term support line and 50-bar SMA.
As a result, buyers will stay hopeful while targeting $1,590 and a one-week-old rising trend line, at $1,595 now, a break of which could propel the yellow metal towards $1,600 round-figure.
In a case where the bulls manage to dominate past-$1,600, the precious metal’s run-up to the yearly top surrounding $1,612 can’t be ruled out.
On the downside break below $1,573.30/72.80 confluence, a bearish chart pattern gets confirmed.
With that, sellers could aim for a late-January low near $1,564 prior to targeting the yearly low near $1,517.
Gold four-hour chart
Trend: Bullish
