- Dollar weakness powers gold to session a session high of $1,967.
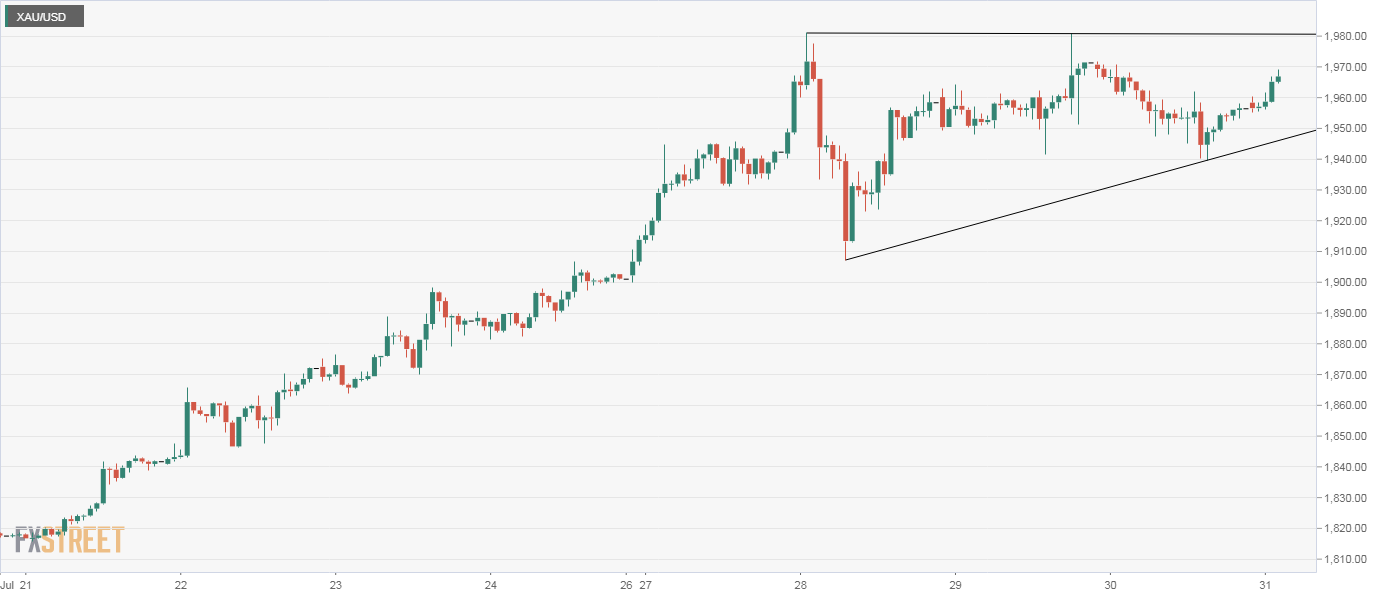
- The metal’s hourly chart shows an ascending triangle.
- A breakout would open the doors for $2,000.
Gold is trading at a session high of $1,967 per ounce, representing a 0.57% gain on the day, The yellow metal is drawing bids amid sustained weakness in the US dollar, the yellow metal’s biggest nemesis.
The dollar index, which tracks the value of the greenback against majors, is currently trading at 92.66 – the lowest level since May 2018.
Going back to gold, the yellow metal has carved out an ascending triangle on the hourly chart. An ascending triangle comprises a rising trendline connecting higher lows and a horizontal resistance line.
A move above $1,980 would confirm a breakout and accelerate the rally from lows near $1,800, opening the doors for a convincing move above the $2,000 mark. On the flip side, an ascending triangle breakdown would open the doors for a re-test of Tuesday’s low of $1,906.
Hourly chart
Trend: Neutral
Technical levels
