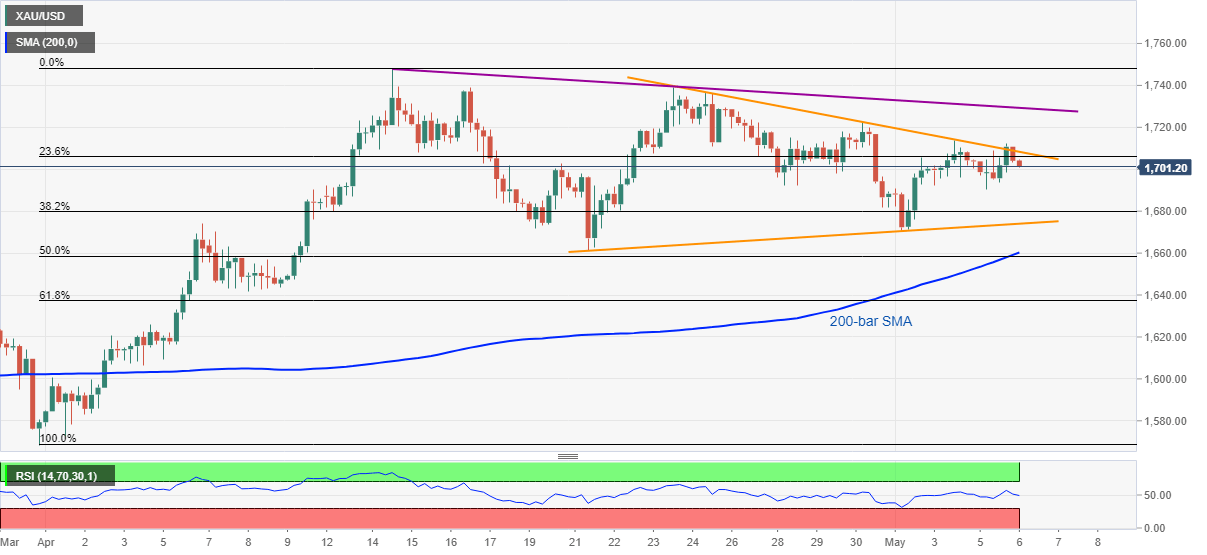
- Gold prices snap three-day winning streak.
- 200-bar SMA, 61.8% Fibonacci retracement will restrict downside below the triangle.
- A three-week-old falling trend line adds to the resistance.
Gold drops to $1,702, down 0.18% on a day, during the Asian session’s trading on Wednesday. That said, the yellow metal keeps trading between the two-week-old symmetrical triangle.
As a result, sellers can aim for the weekly low surrounding $1,690 once the Gold prices drop below $1,700 round-figure. However, the pattern’s support around $1,674 could limit the bullion’s further downside.
If at all bears dominate past-$1,674, 200-bar SMA and 61.8% Fibonacci retracement of March 31 to April 14 upside, respectively, near $1,660 and $1,637, will be on their radars.
Alternatively, a sustained upside break of the said triangle’s resistance, at $1,709 now, can trigger the precious metal’s recovery towards a falling trend line from April 14 that stays around $1,730 at present.
It’s worth mentioning that the bullion’s rise past-$1,730 enables it to challenge the previous month top around $1,748 and aim for the year 2012 high close to $1,496.
Gold four-hour chart
Trend: Further declines expected
