- Bears in control, with $1,685 on the cards on a break of $1,703.
- Significant longs being closed as markets take profit on long gold futures positioning.
Gold prices have deteriorated sharply in recent days, falling below a key monthly support level which would now be expected to act as a firm resistance, as illustrated in the top-down analysis below.
However, the question is how far can gold fall before the bulls reengage, given that the long-term fundamental backdrop is still bullish because of higher inflation expectations and lower real yields?
The futures market can help to determine this and by looking at the latest CFTC report, money managers yet again lightened their long gold exposure, as a continued sharp rise in yields across the curve outpace inflation expectations, fulling a bid in the US dollar.
”Higher Treasury yields and the steeper curve are changing relative funding costs and tilting opportunity costs higher, which is making many investors reluctant to hold the yellow metal,” analysts at TD Securities explained.
With that being said, what we have not seen from the latest data is any new short positions being added which limits the prospects of an immediate downside extension.
”However, with yields on 10s moving north of 1.5% and prices sinking to $1,730/oz it is likely that there could be more long liquidations and new shorts coming into the market, as technicals and rates pressure prices toward the $1,600s,” the analysts argued, suggesting that there could be more bad news before the yellow metal rebounds.”
Then, when taking into consideration the US dollar, despite net USD short positions remaining within recent ranges, USD strengthened at the end of the week.
The market’s expectations regarding the Federal Reserve’s interest rate policy has shifted.
”Since the reflation trade is centred around US fiscal policy and growth expectations, the USD could prove to be more resilient then the consensus has been expecting,” analysts at Rabobank explained.
Gold technical analysis
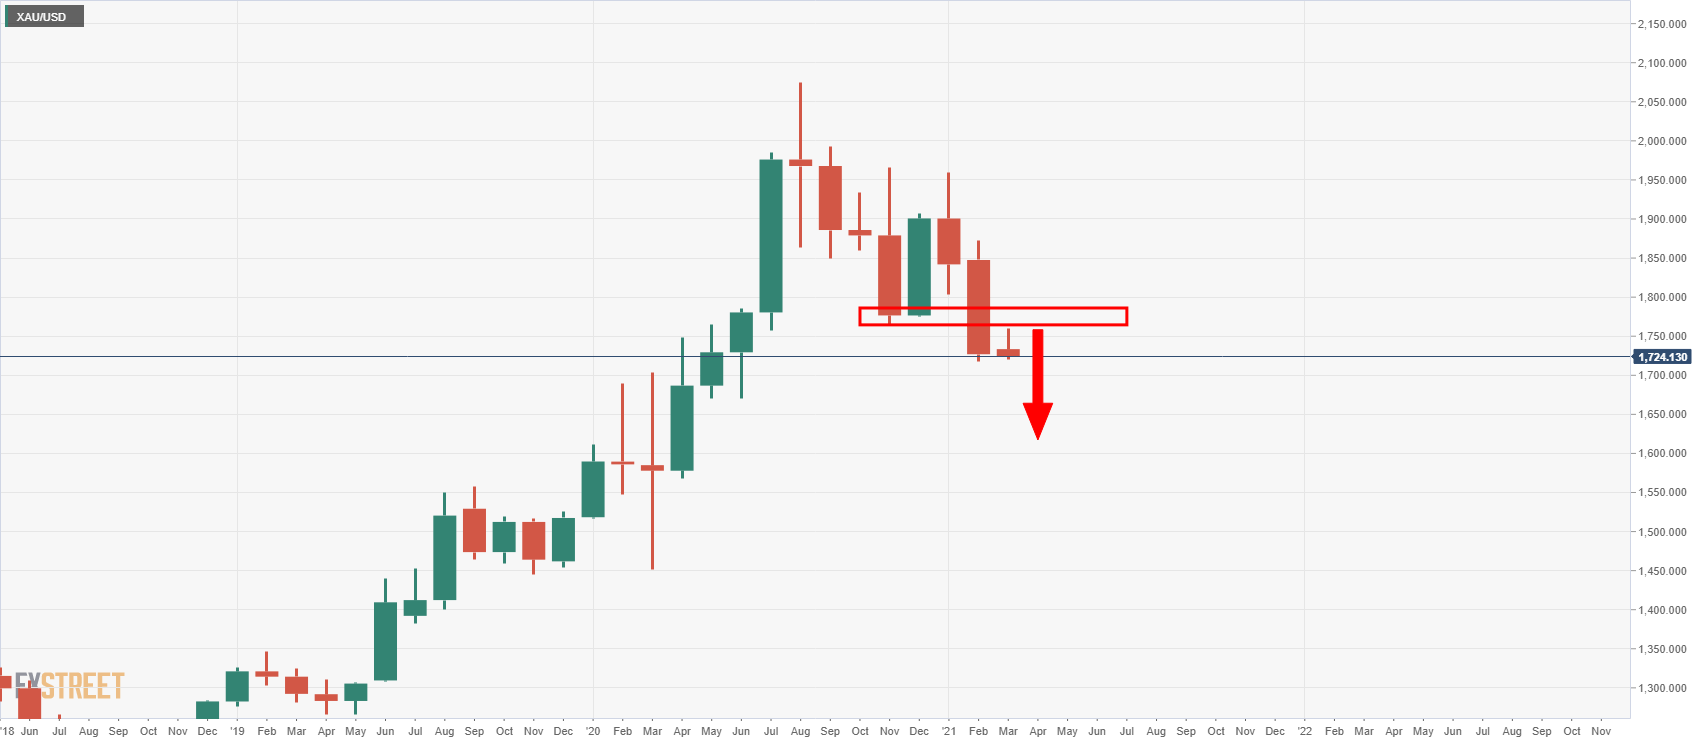
As mentioned, the price has closed below monthly support which would now be expected to be retested as resistance on the lower time frames as follows:
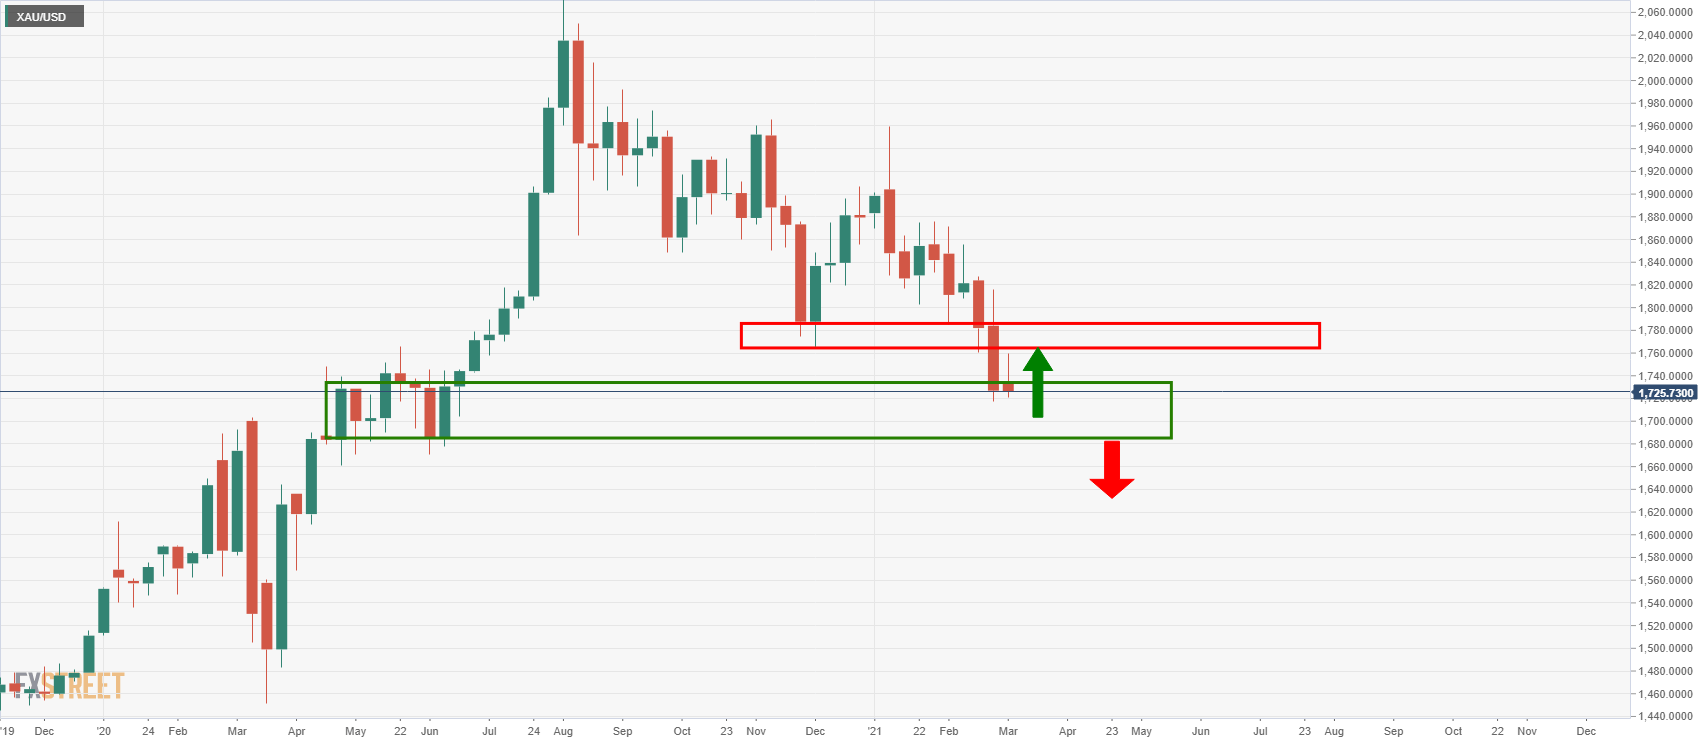
The weekly chart offers a layer of strong support which would be expected to be tested properly only once there has been a significant test of prior support as follows:
Daily chart
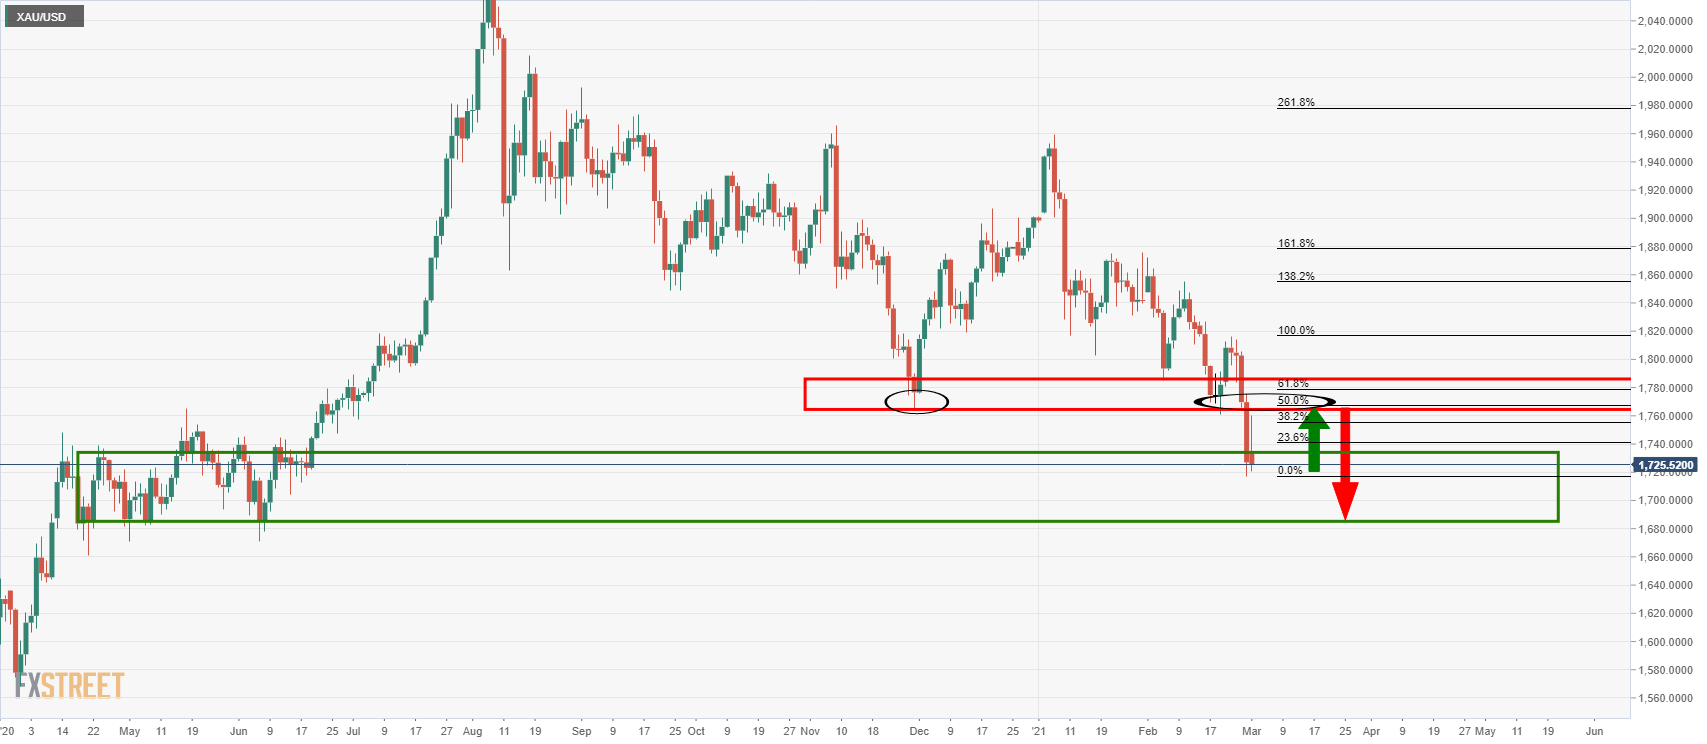
As illustrated, the price is meeting support and a 50% mean reversion at this juncture has a perfect confluence of prior lows and resistance structure.
Failures there will open prospects for a deeper move into demand territory for a potential break below the $1,700 mark, a level that would be expected to be a tough nut to crack.
The deeper target cones in $1,685 as being a -61.8% Fibonacci retracement of the range of the anticipated 50% mean reversion.
