Gold bulls are taking a breather before resuming the recent uptrend, as the life-time highs of $2055 still remain on the radar. ‘Buying the dips’ theme will continue to play out amid fiscal stimulus expectations and concerns over the slowing jobs in the US.
Meanwhile, tumbling US Treasury yields, in the face of the worries over faltering US economic recovery, continue to remain supportive of the yieldless gold. Let’s take a look at the key technical levels to be considered ahead of the US data.
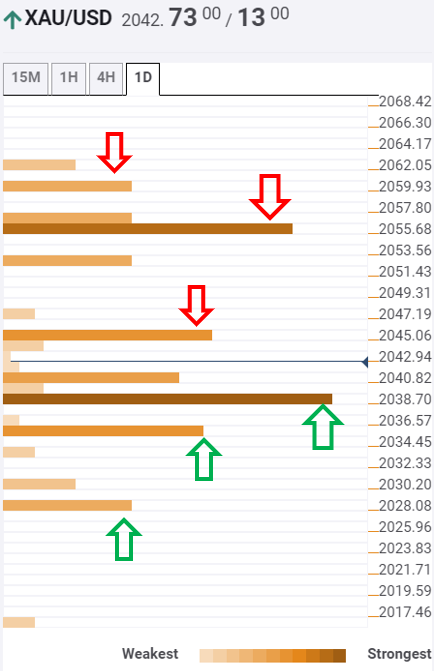
Key XAU/USD resistances and supports
The tool shows that the bright metal has managed to regain the critical support at $2039, which is the convergence of pivot point one-week R2, Fibonacci 38.2% one-day and SMA5 four-hour.
Therefore, to the upside, the immediate resistance lies at $2046, the confluence of the previous high on four-hour, Fibonacci 23.6% one-day and Bollinger Band 15-minutes Upper.
Further north, the rebound could be challenged at $2053, the Bollinger Band one-day Upper. Holding onto that level will call for a retest of the record highs at $2055, which is also the pivot point one-month R1.
Beyond that level, minor resistance at $2060 (pivot point one-day R1) could be tested.
To the downside, $2034 is the immediate cushion, which is the intraday low so far. A breach of the latter will expose the Fibonacci 61.8% one-day support at $2028.
Here is how it looks on the tool
About the Confluence Detector
The TCI (Technical Confluences Indicator) is a tool to locate and point out those price levels where there is a congestion of indicators, moving averages, Fibonacci levels, Pivot Points, etc. Knowing where these congestion points are located is very useful for the trader, and can be used as a basis for different strategies.
Learn more about Technical Confluence
